
SOLD JAN 31, 2020
RENTED DEC 12, 2024
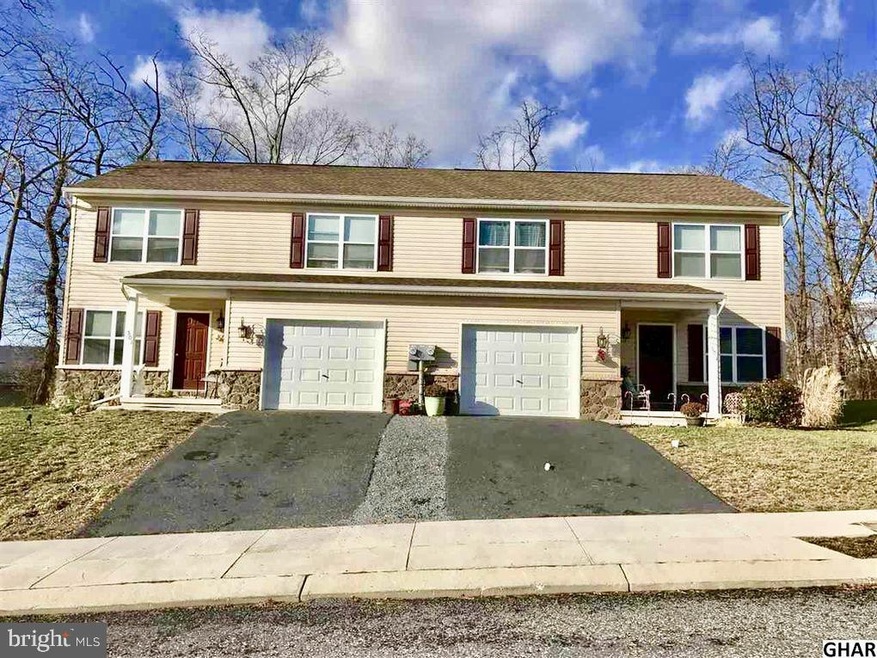
503 Dakemich Ct Enola, PA 17025
East Pennsboro Neighborhood
3
Beds
2.5
Baths
1,523
Sq Ft
$45/mo
HOA Fee
About This Home
As of January 2020For comps purposes only
Ownership History
Date
Name
Owned For
Owner Type
Purchase Details
Listed on
Mar 19, 2020
Closed on
Jan 29, 2020
Sold by
Shake Bros Lp
Bought by
Pedavelis Properties Llc
Seller's Agent
datacorrect BrightMLS
Non Subscribing Office
Buyer's Agent
Nabil Dawood
Harrisburg Property Management Group
List Price
$150,000
Sold Price
$150,000
Current Estimated Value
Home Financials for this Owner
Home Financials are based on the most recent Mortgage that was taken out on this home.
Estimated Appreciation
$100,818
Avg. Annual Appreciation
10.03%
Original Mortgage
$112,500
Outstanding Balance
$90,865
Interest Rate
3.7%
Mortgage Type
Commercial
Estimated Equity
$159,953
Similar Homes in Enola, PA
Create a Home Valuation Report for This Property
The Home Valuation Report is an in-depth analysis detailing your home's value as well as a comparison with similar homes in the area
Home Values in the Area
Average Home Value in this Area
Purchase History
| Date | Type | Sale Price | Title Company |
|---|---|---|---|
| Deed | $150,000 | None Available |
Source: Public Records
Mortgage History
| Date | Status | Loan Amount | Loan Type |
|---|---|---|---|
| Open | $112,500 | Commercial |
Source: Public Records
Property History
| Date | Event | Price | Change | Sq Ft Price |
|---|---|---|---|---|
| 12/12/2024 12/12/24 | Rented | $1,595 | 0.0% | -- |
| 12/06/2024 12/06/24 | For Rent | $1,595 | 0.0% | -- |
| 03/19/2020 03/19/20 | For Sale | $150,000 | 0.0% | $98 / Sq Ft |
| 01/31/2020 01/31/20 | Sold | $150,000 | -- | $98 / Sq Ft |
| 01/03/2020 01/03/20 | Pending | -- | -- | -- |
Source: Bright MLS
Tax History Compared to Growth
Tax History
| Year | Tax Paid | Tax Assessment Tax Assessment Total Assessment is a certain percentage of the fair market value that is determined by local assessors to be the total taxable value of land and additions on the property. | Land | Improvement |
|---|---|---|---|---|
| 2025 | $3,278 | $158,800 | $62,000 | $96,800 |
| 2024 | $3,092 | $158,800 | $62,000 | $96,800 |
| 2023 | $2,917 | $158,800 | $62,000 | $96,800 |
| 2022 | $2,742 | $158,800 | $62,000 | $96,800 |
| 2021 | $2,696 | $158,800 | $62,000 | $96,800 |
| 2020 | $2,633 | $158,800 | $62,000 | $96,800 |
| 2019 | $2,601 | $158,800 | $62,000 | $96,800 |
| 2018 | $2,572 | $158,800 | $62,000 | $96,800 |
| 2017 | $2,462 | $158,800 | $62,000 | $96,800 |
| 2016 | -- | $158,800 | $62,000 | $96,800 |
| 2015 | -- | $158,800 | $62,000 | $96,800 |
| 2014 | -- | $40,000 | $40,000 | $0 |
Source: Public Records
Agents Affiliated with this Home
-
AMBER CRUZ
Seller's Agent in 2024
AMBER CRUZ
Harrisburg Property Management Group
(717) 329-8577
1 in this area
127 Total Sales
-
Liza Hargraves
Buyer's Agent in 2024
Liza Hargraves
Harrisburg Property Management Group
(717) 836-5937
17 Total Sales
-
datacorrect BrightMLS
d
Seller's Agent in 2020
datacorrect BrightMLS
Non Subscribing Office
-
Nabil Dawood
Buyer's Agent in 2020
Nabil Dawood
Harrisburg Property Management Group
(717) 329-9961
2 in this area
19 Total Sales
Map
Source: Bright MLS
MLS Number: PACB122636
APN: 09-14-0832-407
Disclaimer: Certain information contained herein is derived from information provided by parties other than Homes.com. All information provided is deemed reliable, but is not guaranteed to be accurate and should be independently verified.
![]() The data relating to real estate for sale on this website appears in part through the BRIGHT Internet Data Exchange program, a voluntary cooperative exchange of property listing data between licensed real estate brokerage firms, and is provided by BRIGHT through a licensing agreement.
The data relating to real estate for sale on this website appears in part through the BRIGHT Internet Data Exchange program, a voluntary cooperative exchange of property listing data between licensed real estate brokerage firms, and is provided by BRIGHT through a licensing agreement.
Listing information is from various brokers who participate in the Bright MLS IDX program and not all listings may be visible on the site.
The property information being provided on or through the website is for the personal, non-commercial use of consumers and such information may not be used for any purpose other than to identify prospective properties consumers may be interested in purchasing.
Some properties which appear for sale on the website may no longer be available because they are for instance, under contract, sold or are no longer being offered for sale.
Property information displayed is deemed reliable but is not guaranteed.
Copyright 2025 Bright MLS, Inc.
Nearby Homes
- 337 W Perry St
- 202 E Cumberland Rd
- 302 Wertzville Rd
- 235 Wyoming Ave
- 11 Salt Rd
- 42 Beaver Ave
- 104 Bungalow Rd
- 114 Austin Dr
- 311 S Enola Dr
- 315 S Enola Dr
- 48 Ashford Dr
- 510 Peppercorn Square
- 129 Henry Rd
- 41 Pine Ridge Ct
- 13 W Locust St
- 51 Oliver Rd
- 530 S Enola Rd
- 920 Valley Rd
- 28 Logans Run
- 309 Park Ave