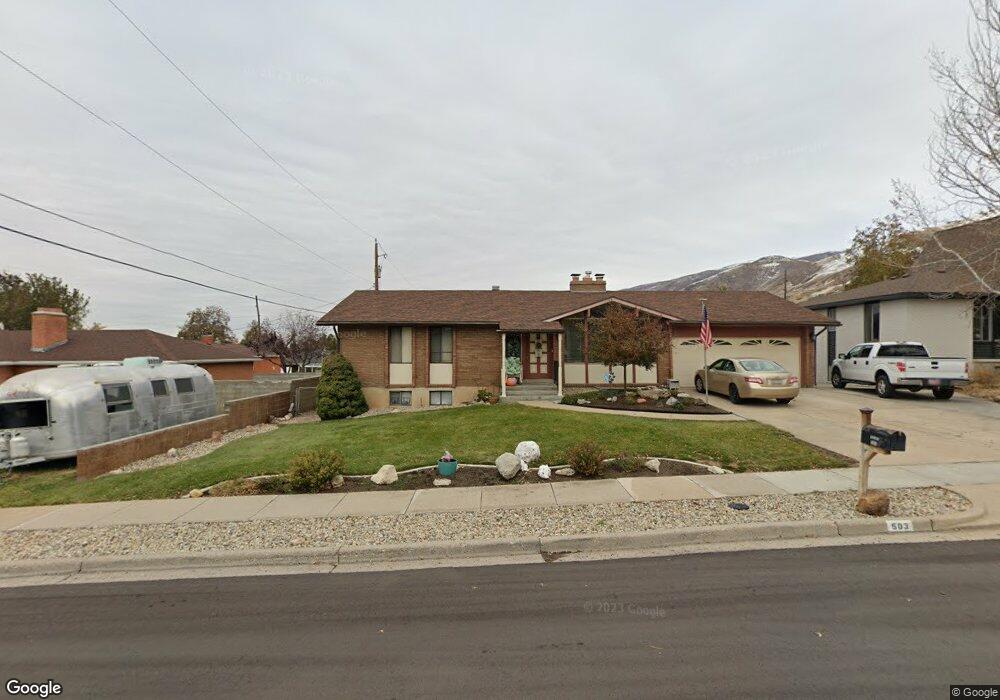
503 E 350 N Bountiful, UT 84010
Estimated Value: $621,000 - $648,429
--
Bed
3
Baths
1,864
Sq Ft
$342/Sq Ft
Est. Value
About This Home
This home is located at 503 E 350 N, Bountiful, UT 84010 and is currently estimated at $637,857, approximately $342 per square foot. 503 E 350 N is a home located in Davis County with nearby schools including Holbrook Elementary School, Bountiful Junior High School, and Bountiful High School.
Ownership History
Date
Name
Owned For
Owner Type
Purchase Details
Closed on
Mar 11, 2002
Sold by
Jarman John Charles and Jarman Carol Ann Bradwhaw
Bought by
Jarman John Charles and Jarman Carol Ann Bradshaw
Current Estimated Value
Home Financials for this Owner
Home Financials are based on the most recent Mortgage that was taken out on this home.
Original Mortgage
$18,600
Interest Rate
6.99%
Purchase Details
Closed on
Apr 19, 1999
Sold by
Jarman John C and Jarman Carol B
Bought by
Jarman John Charles and Jarman Carol Ann Bradshaw
Create a Home Valuation Report for This Property
The Home Valuation Report is an in-depth analysis detailing your home's value as well as a comparison with similar homes in the area
Purchase History
| Date | Buyer | Sale Price | Title Company |
|---|---|---|---|
| Jarman John Charles | -- | Associated Title Company | |
| Jarman John Charles | -- | Associated Title Company | |
| Jarman John Charles | -- | -- |
Source: Public Records
Mortgage History
| Date | Status | Borrower | Loan Amount |
|---|---|---|---|
| Closed | Jarman John Charles | $18,600 |
Source: Public Records
Tax History
| Year | Tax Paid | Tax Assessment Tax Assessment Total Assessment is a certain percentage of the fair market value that is determined by local assessors to be the total taxable value of land and additions on the property. | Land | Improvement |
|---|---|---|---|---|
| 2025 | $3,812 | $343,201 | $160,485 | $182,716 |
| 2024 | $3,596 | $334,950 | $148,715 | $186,235 |
| 2023 | $3,553 | $602,000 | $275,890 | $326,110 |
| 2022 | $3,709 | $345,401 | $147,791 | $197,610 |
| 2021 | $3,225 | $459,000 | $220,201 | $238,799 |
| 2020 | $2,842 | $405,000 | $200,365 | $204,635 |
| 2019 | $2,846 | $396,000 | $183,711 | $212,289 |
| 2018 | $2,702 | $370,000 | $172,457 | $197,543 |
| 2016 | $2,246 | $165,935 | $60,719 | $105,216 |
| 2015 | $2,217 | $154,660 | $60,719 | $93,941 |
| 2014 | $1,992 | $142,017 | $60,719 | $81,298 |
| 2013 | -- | $134,797 | $55,216 | $79,581 |
Source: Public Records
Map
Nearby Homes
- 683 E 100 N
- 513 N 400 E Unit 14B
- 453 N 400 E Unit 7-D
- 129 N 800 E
- 6 N 800 E
- 49 E 200 N Unit 4
- 41 E 200 N Unit 6
- 55 E 200 N Unit 2
- 51 E 200 N Unit 3
- 17 E 400 N Unit 19B
- 256 N Main St
- 254 N Main St
- 252 N Main St
- 255 E 400 S
- 978 N 170 E
- 456 E 500 S
- 520 S Orchard Dr Unit 17
- 357 S 100 E
- 275 E Peach Ln S
- 214 E 1250 N
Your Personal Tour Guide
Ask me questions while you tour the home.