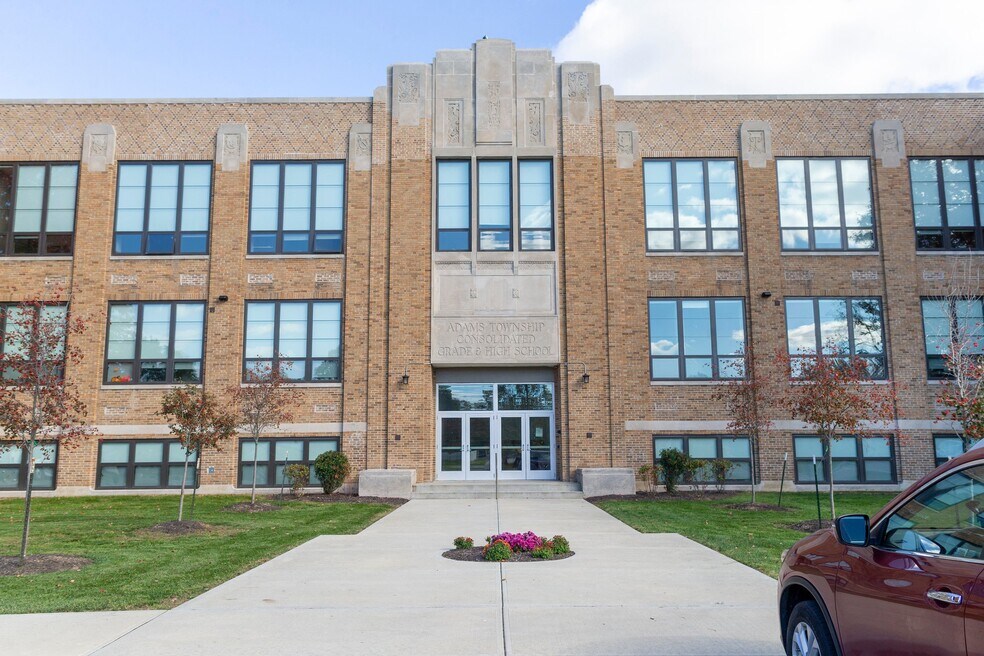
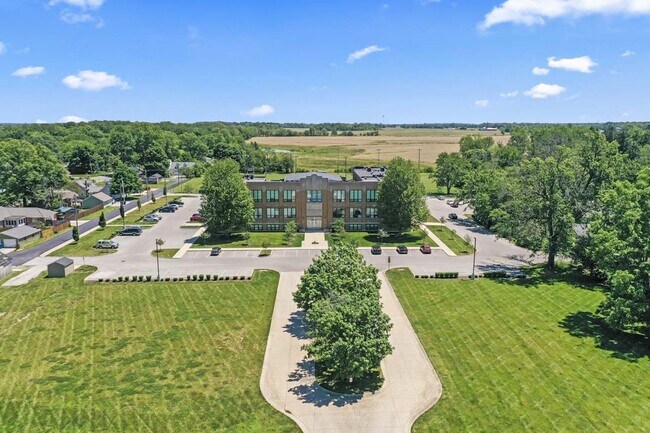
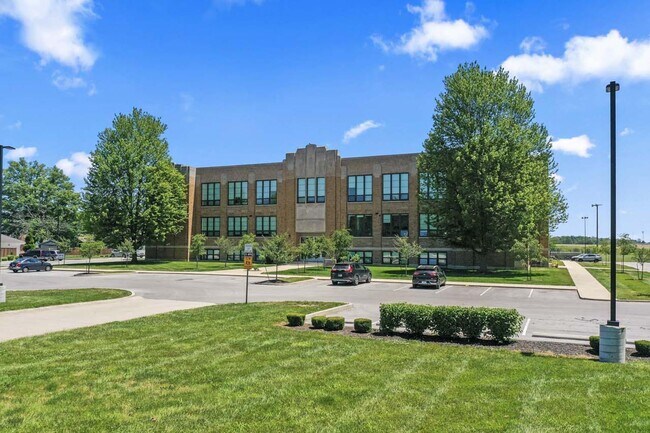
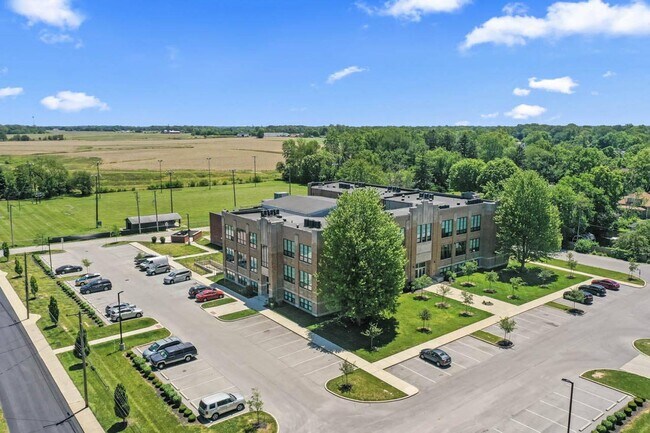
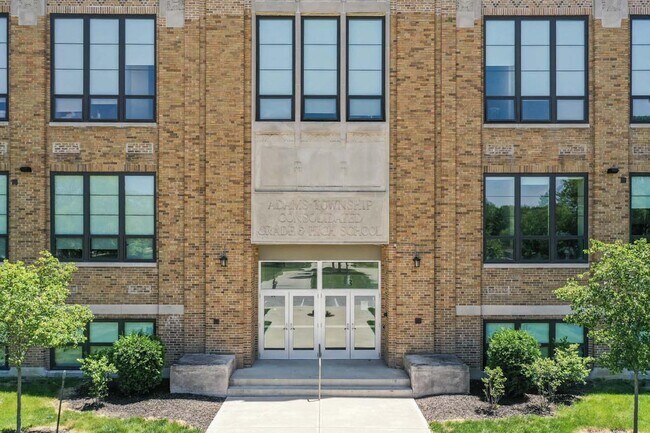
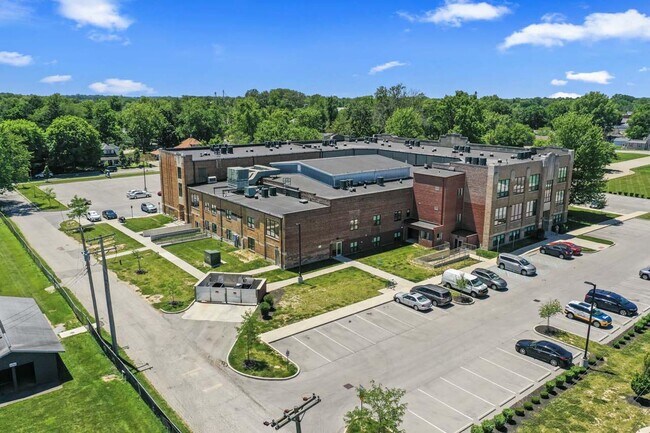
About Blackhawk Commons
Welcome to Blackhawk Commons, where affordability meets high quality living. Our apartment community in Sheridan, Indiana offers a range of amenities to enhance your lifestyle. From our on-site maintenance and laundry facilities to our fitness center and community library, we have everything you need for convenience and comfort. Our apartments feature modern appliances, high ceilings, and wheelchair accessibility, ensuring that you have all the comforts of home. With a variety of floor plans available, including one, two, and three-bedroom units, you'll find the perfect space to fit your needs. Don't miss out on this opportunity to live in a community that values affordability and quality. Call us at or email us at to schedule a tour and secure your new home today.
This institution is an equal opportunity provider.

Pricing and Floor Plans
3 Bedrooms
Three Bedroom
$840 - $882
3 Beds, 2 Baths, 0 Sq Ft
/assets/images/102/property-no-image-available.png
| Unit | Price | Sq Ft | Availability |
|---|---|---|---|
| 210 | $840 | -- | Now |
Map
- 402 E 2nd St
- 514 E 2nd St
- 400 S Georgia St
- 903&905 S Georgia St
- 24145 Hinesley Rd
- 600 S Georgia St
- 390 W State Road 38
- 405 W 3rd St
- 24453 Kercheval St
- 707 S Hamilton Ave
- 1141 S Malott St
- 2710 W State Road 38
- Harmony Plan at Centre Place
- Stamford Plan at Centre Place
- Henley Plan at Centre Place
- Chatham Plan at Centre Place
- Holcombe Plan at Centre Place
- Aldridge Plan at Centre Place
- 407 W 8th St
- 3310 Godby St
- 505 S Georgia St Unit C
- 424 W Warrior Ct
- 1461 Bigleaf Dr
- 1592 E 236th St
- 228 Oakhurst Way
- 2717 W 186th St
- 1067 Beck Way
- 1048 Bald Tree Dr
- 18622 Walsh Way
- 18703 Mithoff Ln
- 20021 Chad Hittle Dr
- 18661 Moray St
- 18661 Moray St
- 19530 Chad Hittle Dr
- 17995 Cunningham Dr
- 414 Elite St
- 20074 Edwick Dr
- 17355 Wellburn Dr Unit ID1373721P
- 17355 NE Wellburn Dr NE
- 17333 Gibbons Place
