
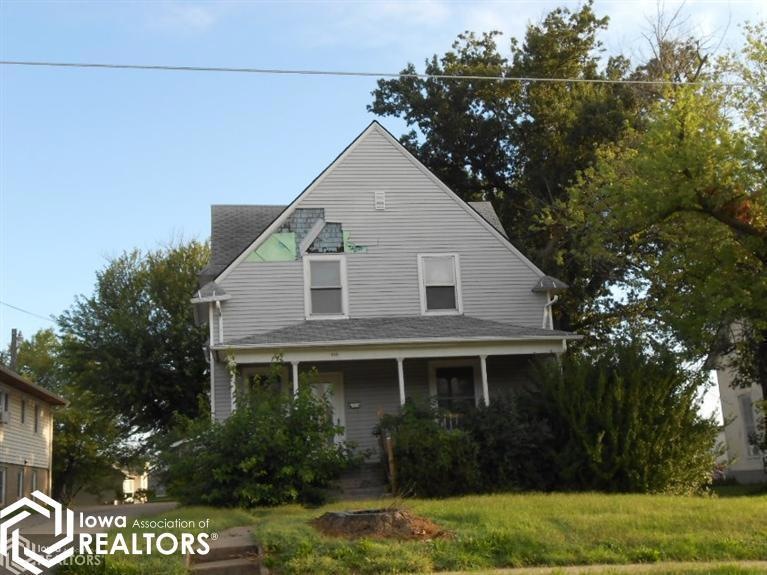
503 E Maple St Centerville, IA 52544
4
Beds
2
Baths
784
Sq Ft
9,000
Sq Ft Lot
About This Home
As of August 2019HUGE PRICE REDUCTION!!!-Foreclosure property. Sells AS IS. Great family home, located on a main street in Centerville. Also has alley access, rear deck, two car detached garage, living room, hot water heat.
Last Agent to Sell the Property
Mark Garretson
Weber Real Estate Listed on: 01/08/2014
Last Buyer's Agent
Mark Garretson
Weber Real Estate Listed on: 01/08/2014
Home Details
Home Type
- Single Family
Est. Annual Taxes
- $1,730
Year Built
- Built in 1954
Lot Details
- 9,000 Sq Ft Lot
- Lot Dimensions are 45 x 200
Parking
- 2 Car Detached Garage
Interior Spaces
- 784 Sq Ft Home
- 2-Story Property
- Basement Fills Entire Space Under The House
Bedrooms and Bathrooms
- 4 Bedrooms
- 2 Full Bathrooms
Ownership History
Date
Name
Owned For
Owner Type
Purchase Details
Listed on
Sep 10, 2018
Closed on
Aug 1, 2019
Sold by
Blozovich Christopher D
Bought by
Sindelar Jeffrey P
Seller's Agent
Jason Oglesby
Iowa Realty South Lakes
Buyer's Agent
Haley Cowan
Real McCoy Realty LLC
List Price
$79,000
Sold Price
$66,000
Premium/Discount to List
-$13,000
-16.46%
Current Estimated Value
Home Financials for this Owner
Home Financials are based on the most recent Mortgage that was taken out on this home.
Estimated Appreciation
$46,398
Avg. Annual Appreciation
9.29%
Original Mortgage
$64,804
Outstanding Balance
$58,107
Interest Rate
4.4%
Mortgage Type
FHA
Estimated Equity
$54,291
Purchase Details
Listed on
Jan 8, 2014
Closed on
Nov 25, 2014
Sold by
Jpmorgan Chase Bank Na
Bought by
Blozovich Christopher Dane
Seller's Agent
Mark Garretson
Weber Real Estate
Buyer's Agent
Mark Garretson
Weber Real Estate
List Price
$66,000
Sold Price
$35,100
Premium/Discount to List
-$30,900
-46.82%
Home Financials for this Owner
Home Financials are based on the most recent Mortgage that was taken out on this home.
Avg. Annual Appreciation
14.45%
Original Mortgage
$23,625
Interest Rate
3.97%
Mortgage Type
New Conventional
Purchase Details
Closed on
May 27, 2005
Sold by
Carney Michael L and Carney Jan E
Bought by
Jamison Robert S and Jamison Jennifer L
Home Financials for this Owner
Home Financials are based on the most recent Mortgage that was taken out on this home.
Original Mortgage
$50,400
Interest Rate
6.87%
Mortgage Type
Adjustable Rate Mortgage/ARM
Similar Homes in Centerville, IA
Create a Home Valuation Report for This Property
The Home Valuation Report is an in-depth analysis detailing your home's value as well as a comparison with similar homes in the area
Home Values in the Area
Average Home Value in this Area
Purchase History
| Date | Type | Sale Price | Title Company |
|---|---|---|---|
| Warranty Deed | $66,000 | -- | |
| Special Warranty Deed | $35,100 | None Available | |
| Warranty Deed | $63,000 | None Available |
Source: Public Records
Mortgage History
| Date | Status | Loan Amount | Loan Type |
|---|---|---|---|
| Open | $64,804 | FHA | |
| Previous Owner | $27,000 | Commercial | |
| Previous Owner | $23,625 | New Conventional | |
| Previous Owner | $75,510 | New Conventional | |
| Previous Owner | $65,088 | New Conventional | |
| Previous Owner | $50,400 | Adjustable Rate Mortgage/ARM |
Source: Public Records
Property History
| Date | Event | Price | Change | Sq Ft Price |
|---|---|---|---|---|
| 08/01/2019 08/01/19 | Sold | $66,000 | -16.5% | $40 / Sq Ft |
| 07/25/2019 07/25/19 | Pending | -- | -- | -- |
| 09/10/2018 09/10/18 | For Sale | $79,000 | +125.1% | $47 / Sq Ft |
| 11/26/2014 11/26/14 | Sold | $35,100 | -46.8% | $45 / Sq Ft |
| 11/12/2014 11/12/14 | Pending | -- | -- | -- |
| 01/08/2014 01/08/14 | For Sale | $66,000 | -- | $84 / Sq Ft |
Source: NoCoast MLS
Tax History Compared to Growth
Tax History
| Year | Tax Paid | Tax Assessment Tax Assessment Total Assessment is a certain percentage of the fair market value that is determined by local assessors to be the total taxable value of land and additions on the property. | Land | Improvement |
|---|---|---|---|---|
| 2024 | $1,730 | $77,890 | $9,810 | $68,080 |
| 2023 | $1,730 | $77,890 | $9,810 | $68,080 |
| 2022 | $1,410 | $62,240 | $7,360 | $54,880 |
| 2021 | $1,410 | $59,840 | $7,360 | $52,480 |
| 2020 | $1,286 | $50,680 | $6,870 | $43,810 |
| 2019 | $643 | $47,290 | $0 | $0 |
| 2018 | $994 | $37,820 | $0 | $0 |
| 2017 | $74,200 | $36,360 | $0 | $0 |
| 2016 | $698 | $36,360 | $0 | $0 |
| 2015 | $698 | $69,660 | $0 | $0 |
| 2014 | $1,844 | $69,660 | $0 | $0 |
Source: Public Records
Agents Affiliated with this Home
-
J
Seller's Agent in 2019
Jason Oglesby
Iowa Realty South Lakes
-
H
Buyer's Agent in 2019
Haley Cowan
Real McCoy Realty LLC
(641) 437-0500
18 in this area
28 Total Sales
-
M
Seller's Agent in 2014
Mark Garretson
Weber Real Estate
Map
Source: NoCoast MLS
MLS Number: NOC5374553
APN: 340011035800000
Disclaimer: Certain information contained herein is derived from information provided by parties other than Homes.com. All information provided is deemed reliable, but is not guaranteed to be accurate and should be independently verified.
![]() IDX information is provided exclusively for personal, non-commercial use, and may not be used for any purpose other than to identify prospective properties consumers may be interested in purchasing.
IDX information is provided exclusively for personal, non-commercial use, and may not be used for any purpose other than to identify prospective properties consumers may be interested in purchasing.
Information is deemed reliable but not guaranteed.
Nearby Homes