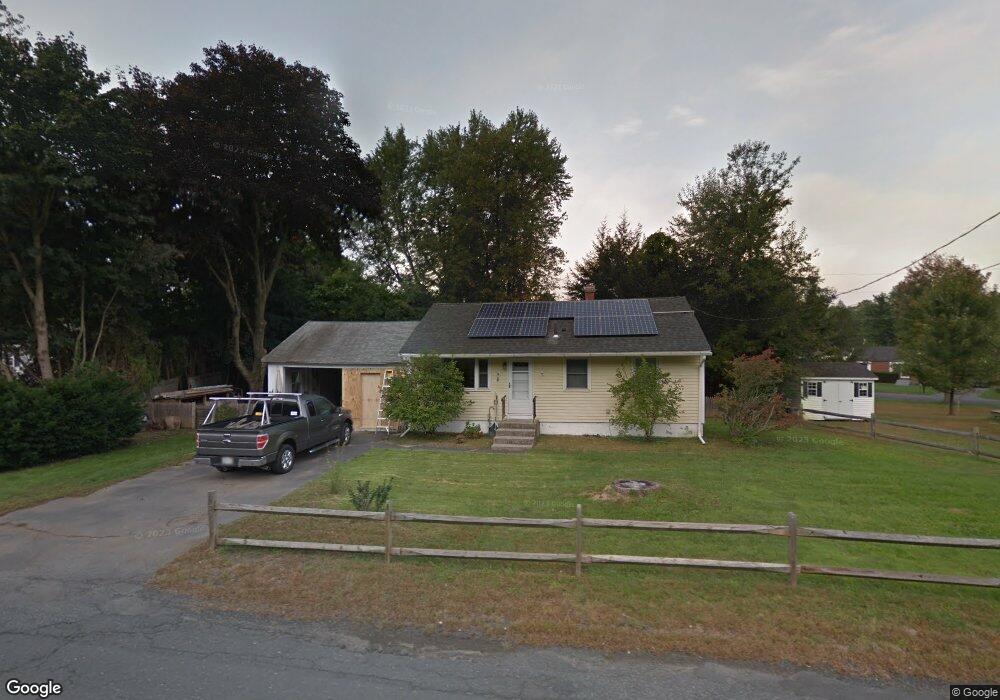
503 East St Easthampton, MA 01027
Estimated Value: $281,000 - $329,047
2
Beds
1
Bath
864
Sq Ft
$357/Sq Ft
Est. Value
About This Home
This home is located at 503 East St, Easthampton, MA 01027 and is currently estimated at $308,512, approximately $357 per square foot. 503 East St is a home located in Hampshire County with nearby schools including Easthampton High School, Tri-County Schools, and New England Adolescent Research Institute.
Ownership History
Date
Name
Owned For
Owner Type
Purchase Details
Closed on
Oct 25, 2018
Sold by
Mulligan Stephen W and Mulligan Kevin M
Bought by
Mulligan Kevin M
Current Estimated Value
Purchase Details
Closed on
Oct 22, 2009
Sold by
Aurora Loan Services L
Bought by
Mulligan Kevin M and Mulligan Stephen W
Purchase Details
Closed on
Aug 24, 2009
Sold by
Garrison Richard
Bought by
Aurora Loan Svcs Llc
Purchase Details
Closed on
Mar 12, 2007
Sold by
Carberry Donald E
Bought by
Rivard Garrison
Home Financials for this Owner
Home Financials are based on the most recent Mortgage that was taken out on this home.
Original Mortgage
$185,000
Interest Rate
6.3%
Mortgage Type
Purchase Money Mortgage
Purchase Details
Closed on
Aug 18, 2000
Sold by
King David H
Bought by
Carberry Donald
Home Financials for this Owner
Home Financials are based on the most recent Mortgage that was taken out on this home.
Original Mortgage
$107,855
Interest Rate
8.13%
Mortgage Type
Purchase Money Mortgage
Create a Home Valuation Report for This Property
The Home Valuation Report is an in-depth analysis detailing your home's value as well as a comparison with similar homes in the area
Home Values in the Area
Average Home Value in this Area
Purchase History
| Date | Buyer | Sale Price | Title Company |
|---|---|---|---|
| Mulligan Kevin M | -- | -- | |
| Mulligan Kevin M | $135,000 | -- | |
| Aurora Loan Svcs Llc | $157,000 | -- | |
| Rivard Garrison | $185,000 | -- | |
| Carberry Donald | $109,000 | -- |
Source: Public Records
Mortgage History
| Date | Status | Borrower | Loan Amount |
|---|---|---|---|
| Previous Owner | Rivard Garrison | $185,000 | |
| Previous Owner | Carberry Donald | $131,000 | |
| Previous Owner | Carberry Donald | $107,855 | |
| Previous Owner | Carberry Donald | $96,579 |
Source: Public Records
Tax History Compared to Growth
Tax History
| Year | Tax Paid | Tax Assessment Tax Assessment Total Assessment is a certain percentage of the fair market value that is determined by local assessors to be the total taxable value of land and additions on the property. | Land | Improvement |
|---|---|---|---|---|
| 2025 | $3,687 | $269,700 | $107,300 | $162,400 |
| 2024 | $3,557 | $262,300 | $104,100 | $158,200 |
| 2023 | $2,823 | $192,700 | $82,000 | $110,700 |
| 2022 | $3,185 | $192,700 | $82,000 | $110,700 |
| 2021 | $8,980 | $198,300 | $82,000 | $116,300 |
| 2020 | $3,422 | $192,700 | $82,000 | $110,700 |
| 2019 | $9,875 | $185,900 | $82,000 | $103,900 |
| 2018 | $2,755 | $172,200 | $77,400 | $94,800 |
| 2017 | $2,688 | $165,800 | $74,400 | $91,400 |
| 2016 | $2,585 | $165,800 | $74,400 | $91,400 |
| 2015 | $2,512 | $165,800 | $74,400 | $91,400 |
Source: Public Records
Map
Nearby Homes
- 78 Holyoke St
- 5 Lownds Ave
- 52 Williston Ave
- 33 Knipfer Ave
- 108 Parsons St
- 52-54 Everett St
- 98 Everett St
- 19 Nicols Way Unit 19
- 2 Clinton St
- 125 Park St
- 6 S St & Abutting Lots
- 4 Laurel Dr
- 12 Glen Cove Place Unit B
- 10 Glen Cove Place Unit A
- 16 Bayberry Dr
- 245 Park St
- 41 South St Unit 11
- 13 Golden Dr
- 119 Central Park Dr
- 77 Central Park Dr