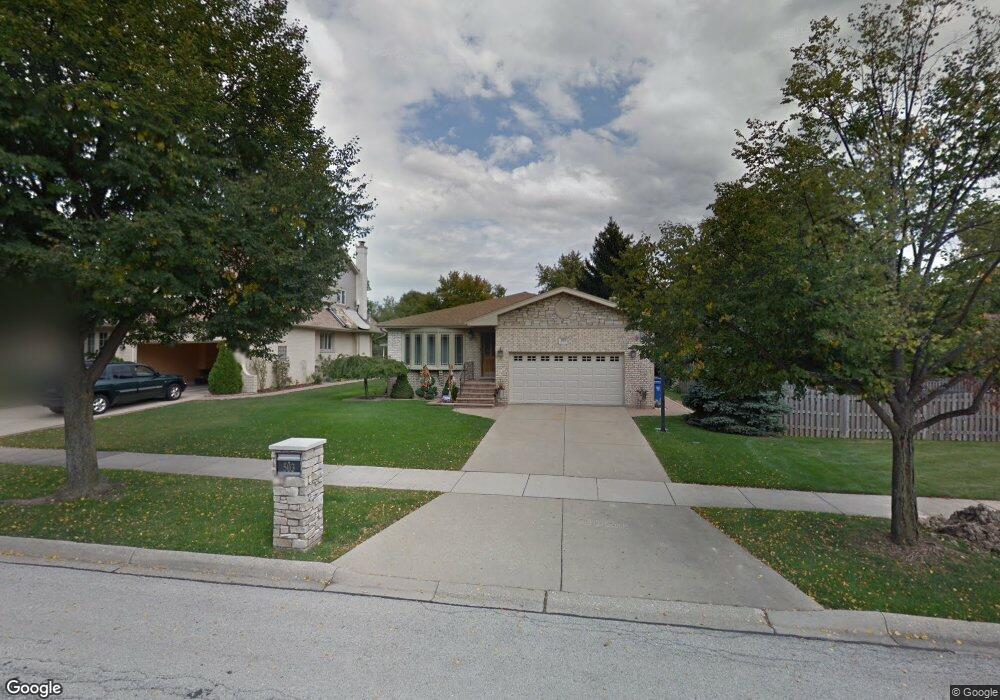
503 Eastman Ct Mount Prospect, IL 60056
North Mount Prospect NeighborhoodEstimated Value: $529,000 - $614,000
3
Beds
2
Baths
1,925
Sq Ft
$291/Sq Ft
Est. Value
About This Home
This home is located at 503 Eastman Ct, Mount Prospect, IL 60056 and is currently estimated at $561,135, approximately $291 per square foot. 503 Eastman Ct is a home located in Cook County with nearby schools including Fairview Elementary School, Lincoln Middle School, and Prospect High School.
Ownership History
Date
Name
Owned For
Owner Type
Purchase Details
Closed on
Aug 30, 2000
Sold by
Koziol Edward and Koziol Rose
Bought by
Gebala Adam and Gebala Rosalena
Current Estimated Value
Home Financials for this Owner
Home Financials are based on the most recent Mortgage that was taken out on this home.
Original Mortgage
$233,600
Outstanding Balance
$85,380
Interest Rate
8.14%
Estimated Equity
$475,755
Create a Home Valuation Report for This Property
The Home Valuation Report is an in-depth analysis detailing your home's value as well as a comparison with similar homes in the area
Home Values in the Area
Average Home Value in this Area
Purchase History
| Date | Buyer | Sale Price | Title Company |
|---|---|---|---|
| Gebala Adam | $311,500 | Stewart Title |
Source: Public Records
Mortgage History
| Date | Status | Borrower | Loan Amount |
|---|---|---|---|
| Open | Gebala Adam | $233,600 | |
| Closed | Gebala Adam | $31,150 |
Source: Public Records
Tax History Compared to Growth
Tax History
| Year | Tax Paid | Tax Assessment Tax Assessment Total Assessment is a certain percentage of the fair market value that is determined by local assessors to be the total taxable value of land and additions on the property. | Land | Improvement |
|---|---|---|---|---|
| 2024 | $9,922 | $39,000 | $13,968 | $25,032 |
| 2023 | $9,512 | $39,000 | $13,968 | $25,032 |
| 2022 | $9,512 | $39,000 | $13,968 | $25,032 |
| 2021 | $8,937 | $32,067 | $9,894 | $22,173 |
| 2020 | $8,820 | $32,067 | $9,894 | $22,173 |
| 2019 | $8,823 | $35,670 | $9,894 | $25,776 |
| 2018 | $9,697 | $35,212 | $8,730 | $26,482 |
| 2017 | $9,741 | $35,212 | $8,730 | $26,482 |
| 2016 | $8,662 | $35,212 | $8,730 | $26,482 |
| 2015 | $8,605 | $32,307 | $7,566 | $24,741 |
| 2014 | $8,473 | $32,307 | $7,566 | $24,741 |
| 2013 | $8,452 | $32,307 | $7,566 | $24,741 |
Source: Public Records
Map
Nearby Homes
- 500 E Holly Ave
- 214 N Louis St
- 612 Maple Ct
- 203 N Louis St Unit B
- 1007 Wildwood Ln
- 1400-1500 E Kensington Rd
- 706 N Main St
- 415 N Russel St
- 314 N Pine St
- 1142 N Boxwood Dr Unit B
- 100 S Emerson St Unit E415
- 5 N Maple St
- 1000 N Westgate Rd
- 1121 N Greenfield Ln
- 719 N Elmhurst Ave
- 1214 N Crabtree Ln
- 5 W Central Rd Unit 410
- 1008 N Newberry Ln
- 20 S Main St Unit 301
- 20 S Main St Unit 312