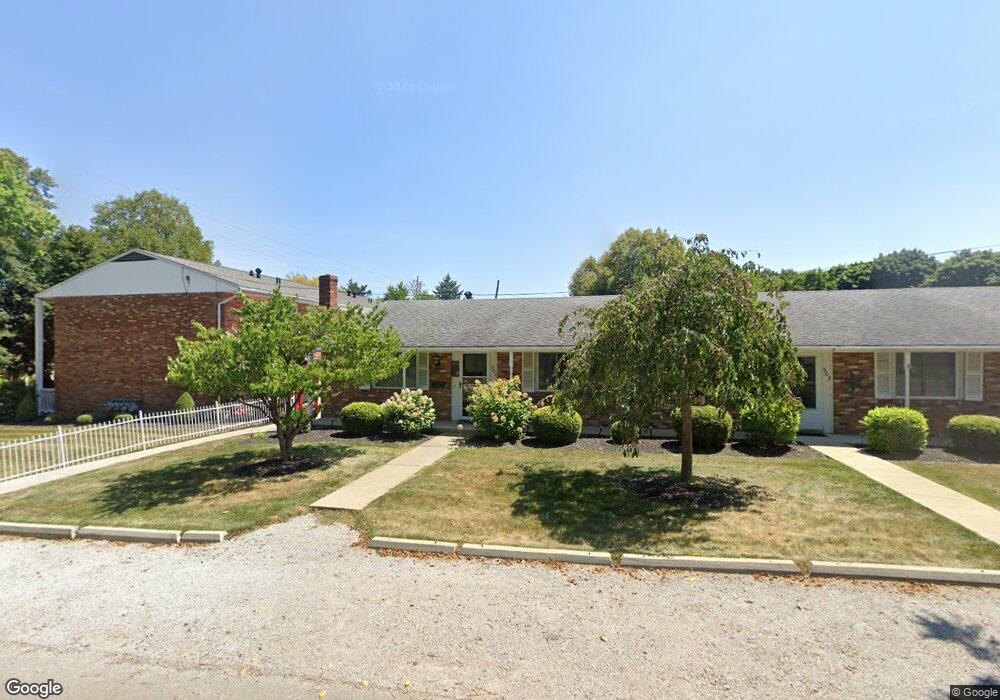
503 Jay St Ashland, OH 44805
Estimated Value: $76,842 - $141,000
2
Beds
1
Bath
900
Sq Ft
$116/Sq Ft
Est. Value
About This Home
This home is located at 503 Jay St, Ashland, OH 44805 and is currently estimated at $104,281, approximately $115 per square foot. 503 Jay St is a home located in Ashland County with nearby schools including Ashland High School, Ashland County Community Academy, and St. Edward Elementary School.
Ownership History
Date
Name
Owned For
Owner Type
Purchase Details
Closed on
Jan 30, 2006
Sold by
Leisure William B
Bought by
Leisure Mary E
Current Estimated Value
Purchase Details
Closed on
Jun 1, 2001
Sold by
Grindle Joyce M
Bought by
Leisure William B
Purchase Details
Closed on
Jan 6, 1999
Sold by
Kendig Edward S
Bought by
Grindle Joyce M
Purchase Details
Closed on
Sep 24, 1993
Bought by
Kendig Edward S
Create a Home Valuation Report for This Property
The Home Valuation Report is an in-depth analysis detailing your home's value as well as a comparison with similar homes in the area
Home Values in the Area
Average Home Value in this Area
Purchase History
| Date | Buyer | Sale Price | Title Company |
|---|---|---|---|
| Leisure Mary E | -- | -- | |
| Leisure William B | $72,000 | -- | |
| Grindle Joyce M | $75,000 | -- | |
| Kendig Edward S | $60,000 | -- |
Source: Public Records
Tax History Compared to Growth
Tax History
| Year | Tax Paid | Tax Assessment Tax Assessment Total Assessment is a certain percentage of the fair market value that is determined by local assessors to be the total taxable value of land and additions on the property. | Land | Improvement |
|---|---|---|---|---|
| 2024 | $329 | $19,280 | $3,470 | $15,810 |
| 2023 | $329 | $19,280 | $3,470 | $15,810 |
| 2022 | $387 | $17,520 | $3,150 | $14,370 |
| 2021 | $389 | $17,520 | $3,150 | $14,370 |
| 2020 | $362 | $17,520 | $3,150 | $14,370 |
| 2019 | $458 | $18,890 | $2,840 | $16,050 |
| 2018 | $462 | $18,890 | $2,840 | $16,050 |
| 2017 | $464 | $18,890 | $2,840 | $16,050 |
| 2016 | $485 | $18,890 | $2,840 | $16,050 |
| 2015 | $480 | $18,890 | $2,840 | $16,050 |
| 2013 | $632 | $21,850 | $2,840 | $19,010 |
Source: Public Records
Map
Nearby Homes