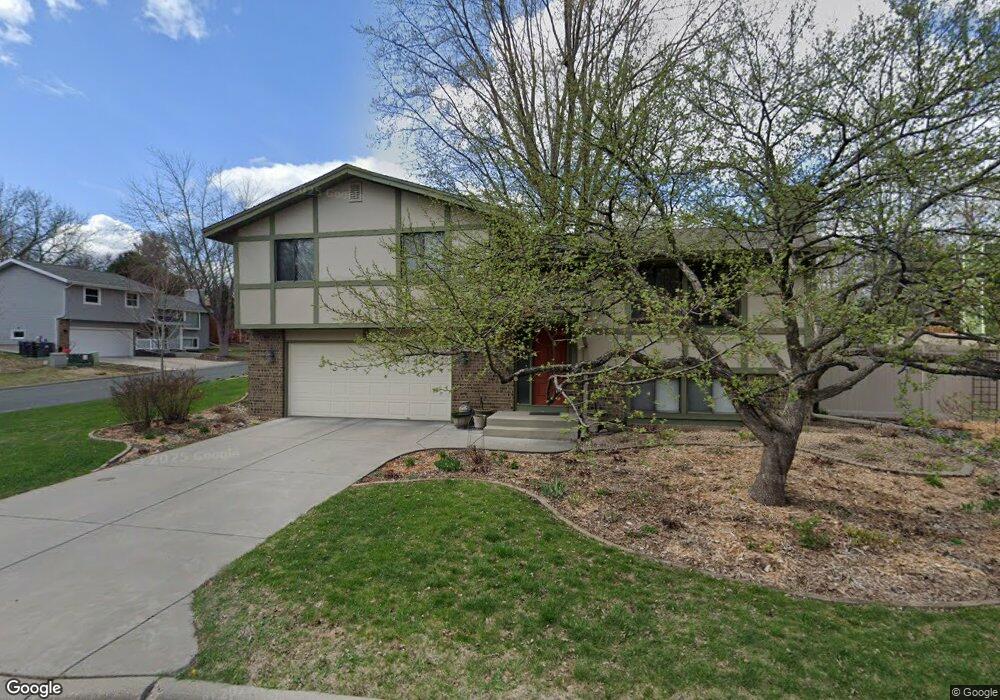
503 Laredo Ln Chanhassen, MN 55317
Estimated Value: $381,000 - $456,000
3
Beds
2
Baths
1,296
Sq Ft
$316/Sq Ft
Est. Value
About This Home
This home is located at 503 Laredo Ln, Chanhassen, MN 55317 and is currently estimated at $409,114, approximately $315 per square foot. 503 Laredo Ln is a home located in Carver County with nearby schools including Chanhassen Elementary School, Pioneer Ridge Middle School, and Chanhassen High School.
Ownership History
Date
Name
Owned For
Owner Type
Purchase Details
Closed on
May 1, 2018
Sold by
Wichteman Robert G and Wichteman Dianne M
Bought by
Pederson Bryan and Pederson Rebecca
Current Estimated Value
Home Financials for this Owner
Home Financials are based on the most recent Mortgage that was taken out on this home.
Original Mortgage
$210,000
Outstanding Balance
$180,983
Interest Rate
4.44%
Mortgage Type
New Conventional
Estimated Equity
$228,131
Purchase Details
Closed on
Jul 31, 2015
Sold by
Wichterman Robert G and Wichterman Dianne M
Bought by
Pederson Bryan and Pederson Rebecca
Home Financials for this Owner
Home Financials are based on the most recent Mortgage that was taken out on this home.
Original Mortgage
$168,000
Interest Rate
4.08%
Mortgage Type
Seller Take Back
Purchase Details
Closed on
Apr 27, 2001
Sold by
Selinger Michelle D
Bought by
Wichterman Robert G and Wichterman Dianne M
Create a Home Valuation Report for This Property
The Home Valuation Report is an in-depth analysis detailing your home's value as well as a comparison with similar homes in the area
Home Values in the Area
Average Home Value in this Area
Purchase History
| Date | Buyer | Sale Price | Title Company |
|---|---|---|---|
| Pederson Bryan | $212,000 | Burnet Title | |
| Pederson Bryan | $212,000 | Burnet Title | |
| Wichterman Robert G | $169,000 | -- |
Source: Public Records
Mortgage History
| Date | Status | Borrower | Loan Amount |
|---|---|---|---|
| Open | Pederson Bryan | $210,000 | |
| Previous Owner | Pederson Bryan | $168,000 |
Source: Public Records
Tax History Compared to Growth
Tax History
| Year | Tax Paid | Tax Assessment Tax Assessment Total Assessment is a certain percentage of the fair market value that is determined by local assessors to be the total taxable value of land and additions on the property. | Land | Improvement |
|---|---|---|---|---|
| 2025 | $3,526 | $374,700 | $135,000 | $239,700 |
| 2024 | $3,578 | $351,400 | $121,500 | $229,900 |
| 2023 | $3,472 | $351,400 | $121,500 | $229,900 |
| 2022 | $3,142 | $344,600 | $114,800 | $229,800 |
| 2021 | $3,060 | $278,100 | $96,400 | $181,700 |
| 2020 | $3,072 | $272,700 | $96,400 | $176,300 |
| 2019 | $3,002 | $256,400 | $91,800 | $164,600 |
| 2018 | $2,816 | $256,400 | $91,800 | $164,600 |
| 2017 | $2,640 | $236,100 | $84,500 | $151,600 |
| 2016 | $2,668 | $191,100 | $0 | $0 |
| 2015 | $1,477 | $221,000 | $0 | $0 |
| 2014 | $1,477 | $200,900 | $0 | $0 |
Source: Public Records
Map
Nearby Homes
- 7406 Laredo Dr
- 5523 Game Farm Lookout
- 710 W Village Rd Unit 105
- 303 W 77th St
- 7639 Nicholas Way
- 760 Bighorn Dr
- 7719 Nicholas Way
- 601 Fox Hill Dr
- 7490 Chanhassen Rd
- 7104 Pontiac Cir
- 1003 Pontiac Ln
- 834 Cree Dr
- 18752 Kristie Ln
- 7080 Quail Cir
- 6620 Horseshoe Curve
- 6690 Nez Perce Dr
- 1000 Carver Beach Rd
- 460 Indian Hill Rd
- 450 Indian Hill Rd
- 970 Pleasantview Rd