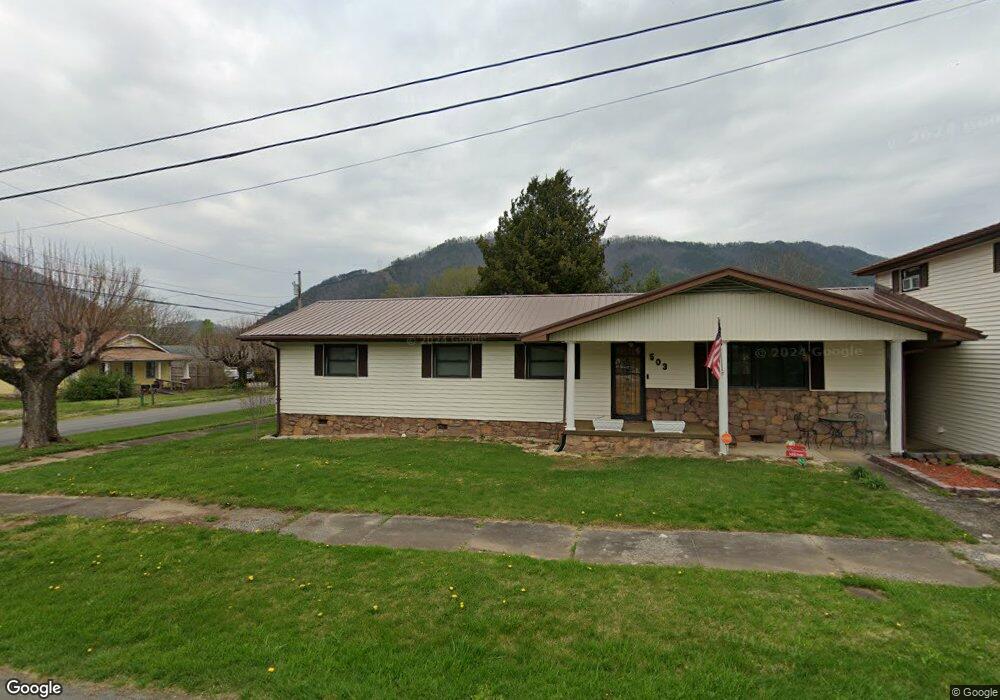
503 Main St Hampton, TN 37658
Hampton NeighborhoodEstimated Value: $157,000 - $238,000
Studio
2
Baths
1,993
Sq Ft
$99/Sq Ft
Est. Value
About This Home
This home is located at 503 Main St, Hampton, TN 37658 and is currently estimated at $198,160, approximately $99 per square foot. 503 Main St is a home located in Carter County.
Ownership History
Date
Name
Owned For
Owner Type
Purchase Details
Closed on
Jun 10, 2020
Sold by
Williams Joe Lester and Williams Wilma
Bought by
Murray Joseph M and Murray Angela M
Current Estimated Value
Home Financials for this Owner
Home Financials are based on the most recent Mortgage that was taken out on this home.
Original Mortgage
$66,400
Outstanding Balance
$45,997
Interest Rate
3.2%
Mortgage Type
New Conventional
Estimated Equity
$152,163
Purchase Details
Closed on
May 21, 2020
Sold by
Williams Joe Lester and Estate Of William C Morton
Bought by
Williams Joe Lester and Williams Wilma
Home Financials for this Owner
Home Financials are based on the most recent Mortgage that was taken out on this home.
Original Mortgage
$66,400
Outstanding Balance
$45,997
Interest Rate
3.2%
Mortgage Type
New Conventional
Estimated Equity
$152,163
Purchase Details
Closed on
Aug 18, 1975
Bought by
Morton William C and Morton Betty
Purchase Details
Closed on
May 15, 1970
Create a Home Valuation Report for This Property
The Home Valuation Report is an in-depth analysis detailing your home's value as well as a comparison with similar homes in the area
Home Values in the Area
Average Home Value in this Area
Purchase History
| Date | Buyer | Sale Price | Title Company |
|---|---|---|---|
| Murray Joseph M | $82,000 | None Available | |
| Williams Joe Lester | -- | None Available | |
| Morton William C | -- | -- | |
| -- | -- | -- |
Source: Public Records
Mortgage History
| Date | Status | Borrower | Loan Amount |
|---|---|---|---|
| Open | Murray Joseph M | $66,400 |
Source: Public Records
Tax History
| Year | Tax Paid | Tax Assessment Tax Assessment Total Assessment is a certain percentage of the fair market value that is determined by local assessors to be the total taxable value of land and additions on the property. | Land | Improvement |
|---|---|---|---|---|
| 2025 | $829 | $38,025 | $8,125 | $29,900 |
| 2024 | $829 | $38,025 | $8,125 | $29,900 |
| 2023 | $829 | $38,025 | $0 | $0 |
| 2022 | $772 | $38,025 | $8,125 | $29,900 |
| 2021 | $772 | $38,025 | $8,125 | $29,900 |
| 2020 | $743 | $38,025 | $8,125 | $29,900 |
| 2019 | $743 | $30,100 | $5,525 | $24,575 |
| 2018 | $743 | $30,100 | $5,525 | $24,575 |
| 2017 | $743 | $30,100 | $5,525 | $24,575 |
| 2016 | $737 | $30,100 | $5,525 | $24,575 |
| 2015 | $737 | $30,100 | $5,525 | $24,575 |
| 2014 | $760 | $31,025 | $5,525 | $25,500 |
Source: Public Records
Map
Nearby Homes
- 157 Spring St
- 122 Ed Stout Rd
- 124 Cates Corner Rd
- Tbd Kaitlin Rd
- 121 Coleman Rd
- 299 Morton Rd
- Lot 19 Mountain View Cir
- Lot 18 Mountain View Cir
- 112 Edgewater Rd
- 220 Jenkins Hollow Rd
- 1104 Rittertown Rd
- 371 Jenkins Hollow Rd
- TBD River Rd
- Tbd John Glover Rd
- 0 Siam Rd
- 116 Jc Vines Rd
- 2739 Siam Rd
- 637 Long Hollow Rd
- Tbd Icy Ln
- Tbd Hampton Dr
Your Personal Tour Guide
Ask me questions while you tour the home.