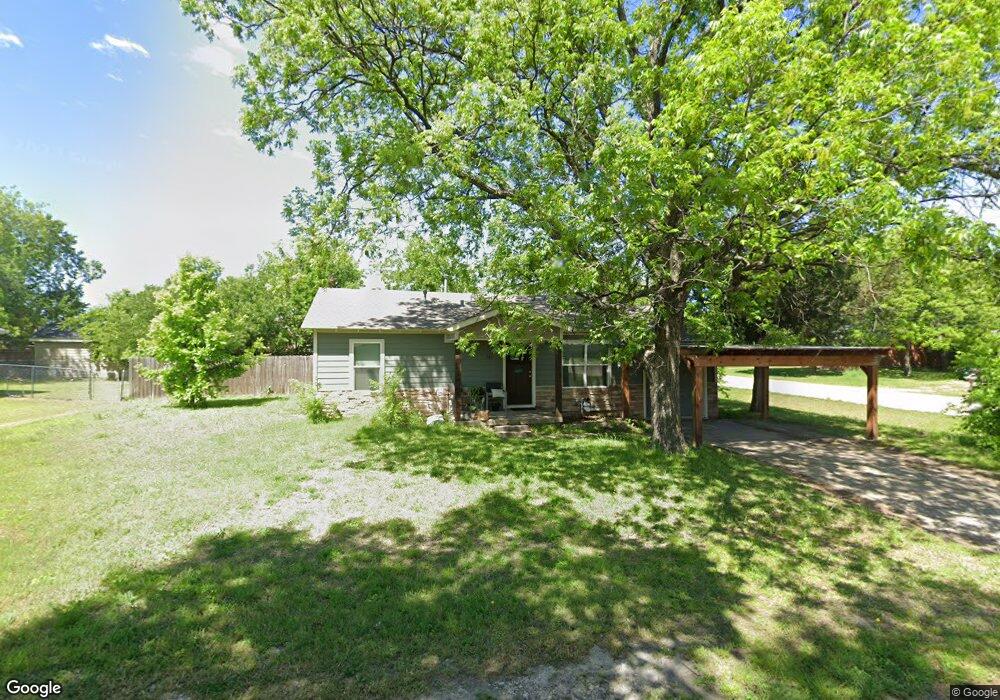
503 N 3rd St Sanger, TX 76266
Estimated Value: $196,976 - $235,000
2
Beds
2
Baths
884
Sq Ft
$242/Sq Ft
Est. Value
About This Home
This home is located at 503 N 3rd St, Sanger, TX 76266 and is currently estimated at $213,744, approximately $241 per square foot. 503 N 3rd St is a home located in Denton County with nearby schools including Butterfield Elementary School, Clear Creek Intermediate School, and Sanger Sixth Grade Campus.
Ownership History
Date
Name
Owned For
Owner Type
Purchase Details
Closed on
Jun 14, 2019
Sold by
Thomas Jeff
Bought by
Highfill Trevor B and Highfill Savannah L
Current Estimated Value
Home Financials for this Owner
Home Financials are based on the most recent Mortgage that was taken out on this home.
Original Mortgage
$152,624
Outstanding Balance
$134,194
Interest Rate
4.1%
Mortgage Type
FHA
Estimated Equity
$79,550
Create a Home Valuation Report for This Property
The Home Valuation Report is an in-depth analysis detailing your home's value as well as a comparison with similar homes in the area
Home Values in the Area
Average Home Value in this Area
Purchase History
| Date | Buyer | Sale Price | Title Company |
|---|---|---|---|
| Highfill Trevor B | -- | None Available |
Source: Public Records
Mortgage History
| Date | Status | Borrower | Loan Amount |
|---|---|---|---|
| Open | Highfill Trevor B | $152,624 |
Source: Public Records
Tax History Compared to Growth
Tax History
| Year | Tax Paid | Tax Assessment Tax Assessment Total Assessment is a certain percentage of the fair market value that is determined by local assessors to be the total taxable value of land and additions on the property. | Land | Improvement |
|---|---|---|---|---|
| 2025 | $3,322 | $165,901 | $63,986 | $108,925 |
| 2024 | $3,322 | $164,393 | $63,986 | $100,407 |
| 2023 | $2,779 | $137,108 | $49,767 | $87,341 |
| 2022 | $3,597 | $162,210 | $39,705 | $122,505 |
| 2021 | $2,927 | $139,264 | $32,486 | $106,778 |
| 2020 | $2,342 | $105,826 | $32,486 | $73,340 |
| 2019 | $1,964 | $86,278 | $32,486 | $53,792 |
| 2018 | $2,101 | $91,783 | $32,486 | $59,297 |
| 2017 | $1,746 | $75,933 | $32,486 | $43,447 |
| 2016 | $1,354 | $58,884 | $18,048 | $40,836 |
| 2015 | -- | $55,351 | $18,048 | $37,303 |
| 2013 | -- | $36,653 | $18,048 | $18,605 |
Source: Public Records
Map
Nearby Homes
- 702 Peach St Unit 2
- 902 Plum St
- 4551 Farm To Market Road 455
- 109 S 5th St
- TBD Interstate 35
- 1010 Bolivar St
- 710 W Willow St
- 4063 Farm To Market 455 W
- 1209 Bolivar St
- 136 Creekside Dr
- 126 Creekside Dr
- 509 Marshall St
- 411 Hughes St
- 10 Covey Ln
- 5 Pheasant Run
- 6 Covey Ln
- Dogwood Plan at Sable Creek
- Violet III Plan at Sable Creek
- Cypress II Plan at Sable Creek
- Dewberry Plan at Sable Creek