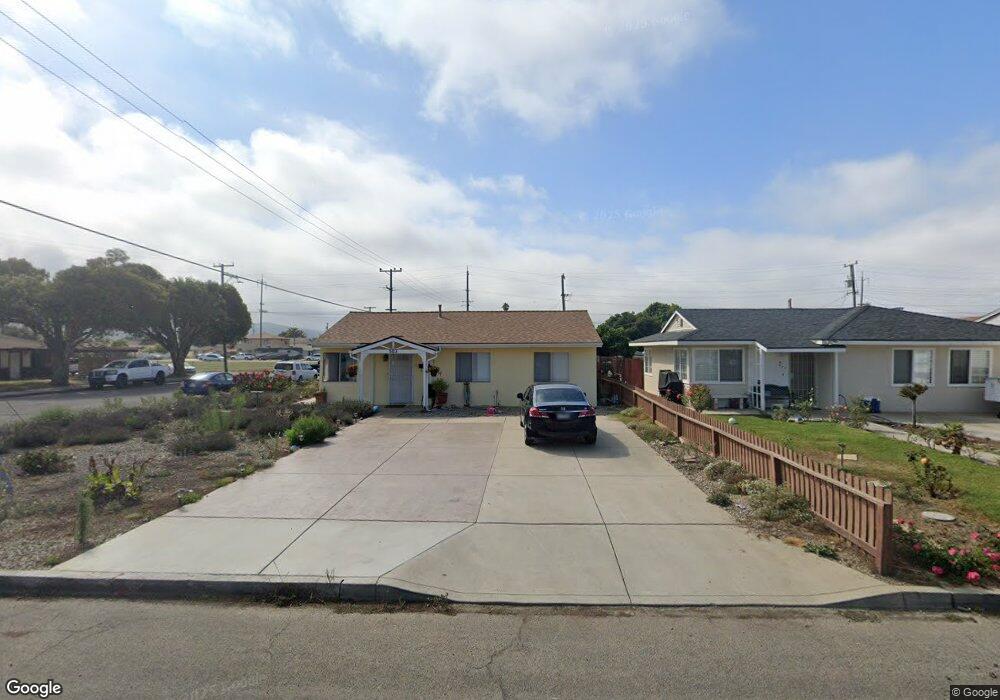
503 N E St Lompoc, CA 93436
Estimated Value: $471,000 - $509,000
3
Beds
2
Baths
1,291
Sq Ft
$383/Sq Ft
Est. Value
About This Home
This home is located at 503 N E St, Lompoc, CA 93436 and is currently estimated at $495,078, approximately $383 per square foot. 503 N E St is a home located in Santa Barbara County with nearby schools including La Honda STEAM Academy, Cabrillo High School, and Olive Grove Charter - Lompoc.
Ownership History
Date
Name
Owned For
Owner Type
Purchase Details
Closed on
Feb 19, 2025
Sold by
Martinez Margarita
Bought by
Martinez-Ortiz Manuel
Current Estimated Value
Home Financials for this Owner
Home Financials are based on the most recent Mortgage that was taken out on this home.
Original Mortgage
$345,000
Outstanding Balance
$342,958
Interest Rate
6.93%
Mortgage Type
New Conventional
Estimated Equity
$152,120
Purchase Details
Closed on
Feb 11, 2025
Sold by
Hudspeth David M and Hudspeth Susan M
Bought by
Martinez-Ortiz Manuel and Martinez Cristobal
Home Financials for this Owner
Home Financials are based on the most recent Mortgage that was taken out on this home.
Original Mortgage
$345,000
Outstanding Balance
$342,958
Interest Rate
6.93%
Mortgage Type
New Conventional
Estimated Equity
$152,120
Purchase Details
Closed on
Sep 18, 2019
Sold by
Hudspeth Susan M
Bought by
Hudspeth David M and Hudspeth Susan M
Create a Home Valuation Report for This Property
The Home Valuation Report is an in-depth analysis detailing your home's value as well as a comparison with similar homes in the area
Home Values in the Area
Average Home Value in this Area
Purchase History
| Date | Buyer | Sale Price | Title Company |
|---|---|---|---|
| Martinez-Ortiz Manuel | -- | None Listed On Document | |
| Martinez-Ortiz Manuel | $460,000 | None Listed On Document | |
| Hudspeth David M | -- | None Available | |
| Hudspeth Susan M | -- | None Available |
Source: Public Records
Mortgage History
| Date | Status | Borrower | Loan Amount |
|---|---|---|---|
| Open | Martinez-Ortiz Manuel | $345,000 |
Source: Public Records
Tax History
| Year | Tax Paid | Tax Assessment Tax Assessment Total Assessment is a certain percentage of the fair market value that is determined by local assessors to be the total taxable value of land and additions on the property. | Land | Improvement |
|---|---|---|---|---|
| 2025 | $636 | $61,344 | $14,316 | $47,028 |
| 2023 | $636 | $58,963 | $13,761 | $45,202 |
| 2022 | $620 | $57,808 | $13,492 | $44,316 |
| 2021 | $623 | $56,676 | $13,228 | $43,448 |
| 2020 | $616 | $56,096 | $13,093 | $43,003 |
| 2019 | $604 | $54,997 | $12,837 | $42,160 |
| 2018 | $592 | $53,920 | $12,586 | $41,334 |
| 2017 | $579 | $52,864 | $12,340 | $40,524 |
| 2016 | $567 | $51,829 | $12,099 | $39,730 |
| 2014 | $552 | $50,053 | $11,685 | $38,368 |
Source: Public Records
Map
Nearby Homes
- 533 N G St
- 510 N I St
- 610 E Pine Ave Unit 10
- 610 E Pine Ave Unit 29
- 610 E Pine Ave Unit 62
- 622 N B St
- 505 N 1st St
- 701 E Pine Ave Unit 182
- 701 E Pine Ave Unit 176
- 701 E Pine Ave Unit 171
- 701 E Pine Ave Unit 161
- 526 N L St
- 801, 851 California 246
- 321 N Third St
- 240 Quail Cir
- 117 S I St
- 205 S E St
- 217 N M St
- 321 W North Ave Unit 133
- 215 S H St
Your Personal Tour Guide
Ask me questions while you tour the home.