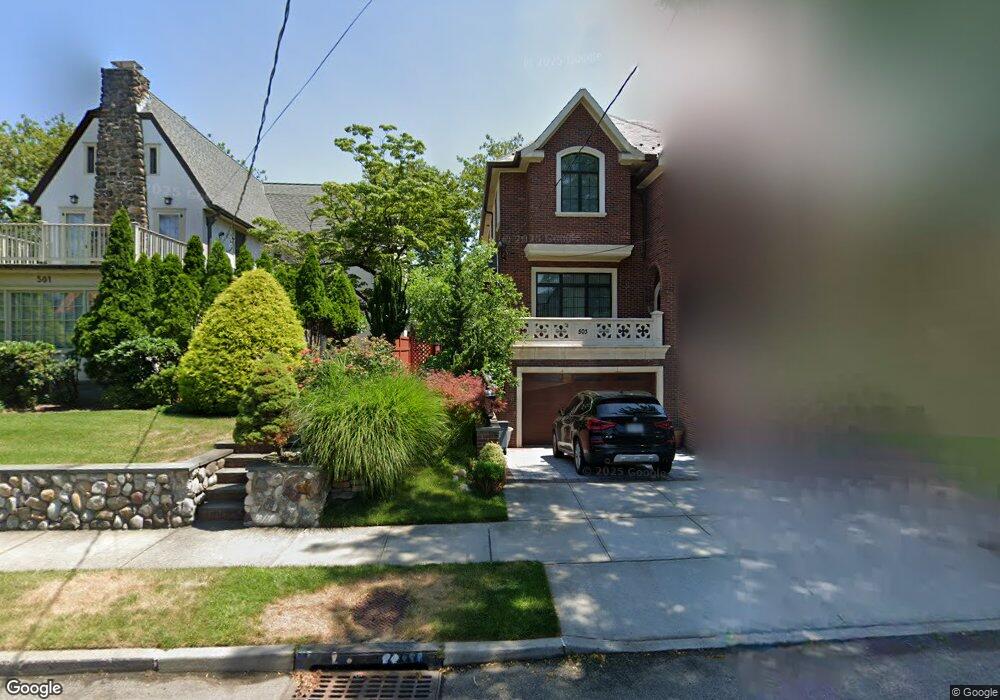
503 Parsons Blvd Unit 503 Whitestone, NY 11357
Whitestone NeighborhoodEstimated Value: $1,907,000 - $2,291,000
4
Beds
5
Baths
2,735
Sq Ft
$775/Sq Ft
Est. Value
About This Home
This home is located at 503 Parsons Blvd Unit 503, Whitestone, NY 11357 and is currently estimated at $2,119,132, approximately $774 per square foot. 503 Parsons Blvd Unit 503 is a home located in Queens County with nearby schools including P.S. 79 - Francis Lewis, J.H.S. 194 William Carr, and Flushing High School.
Ownership History
Date
Name
Owned For
Owner Type
Purchase Details
Closed on
Apr 26, 2023
Sold by
Chung Soo Jung and Chung Sun Chul
Bought by
Cheon Dina and Choi Bok Yon
Current Estimated Value
Home Financials for this Owner
Home Financials are based on the most recent Mortgage that was taken out on this home.
Original Mortgage
$1,200,000
Outstanding Balance
$1,166,633
Interest Rate
6.39%
Mortgage Type
Purchase Money Mortgage
Estimated Equity
$952,499
Purchase Details
Closed on
Jan 11, 2016
Sold by
Grippi Anna and Grippi Casimiro
Bought by
Chung Soo Jung and Chung Sun Chul
Home Financials for this Owner
Home Financials are based on the most recent Mortgage that was taken out on this home.
Original Mortgage
$1,400,000
Interest Rate
3.97%
Mortgage Type
Purchase Money Mortgage
Purchase Details
Closed on
Nov 17, 2011
Sold by
Dwyer Edna M and Dwyer Vincent J
Bought by
Grippi Anna and Grippi Casimiro
Create a Home Valuation Report for This Property
The Home Valuation Report is an in-depth analysis detailing your home's value as well as a comparison with similar homes in the area
Home Values in the Area
Average Home Value in this Area
Purchase History
| Date | Buyer | Sale Price | Title Company |
|---|---|---|---|
| Cheon Dina | $2,015,000 | -- | |
| Chung Soo Jung | $2,036,500 | -- | |
| Grippi Anna | $630,000 | -- |
Source: Public Records
Mortgage History
| Date | Status | Borrower | Loan Amount |
|---|---|---|---|
| Open | Cheon Dina | $1,200,000 | |
| Previous Owner | Chung Soo Jung | $1,400,000 |
Source: Public Records
Tax History
| Year | Tax Paid | Tax Assessment Tax Assessment Total Assessment is a certain percentage of the fair market value that is determined by local assessors to be the total taxable value of land and additions on the property. | Land | Improvement |
|---|---|---|---|---|
| 2025 | $20,216 | $101,880 | $28,258 | $73,622 |
| 2024 | $20,216 | $100,654 | $26,229 | $74,425 |
| 2023 | $19,072 | $94,957 | $24,872 | $70,085 |
| 2022 | $18,270 | $106,860 | $33,600 | $73,260 |
| 2021 | $18,536 | $88,560 | $33,600 | $54,960 |
| 2020 | $17,971 | $97,320 | $33,600 | $63,720 |
| 2019 | $17,546 | $94,740 | $33,600 | $61,140 |
| 2018 | $16,131 | $79,131 | $24,005 | $55,126 |
| 2017 | $15,547 | $76,265 | $26,928 | $49,337 |
| 2016 | $14,673 | $76,265 | $26,928 | $49,337 |
| 2015 | $6,034 | $58,200 | $18,000 | $40,200 |
| 2014 | $6,034 | $18,000 | $18,000 | $0 |
Source: Public Records
Map
Nearby Homes
- 6 Summit Place
- 145-45 4th Ave
- 2-07 Parsons Blvd
- 145-67 5th Ave
- 7-03 147th St
- 145-65 9th Ave
- 147-07 8th Ave
- 23 Center Dr
- 27 Center Dr
- 144-30 South Dr
- 4 Point Crescent
- 3-25 149th St
- 12 Point Crescent
- 14910 7th Ave
- 141-16 11th Ave
- 3-24 150th St
- 14610 13th Ave
- 1-06 Samos Ln
- 1352 145th Place
- 149-62 Powells Cove Blvd
- 94 Parsons Blvd
- 5-03 Parsons Blvd
- 92 Parsons Blvd
- 501 Parsons Blvd
- 90 Parsons Blvd
- 98 Parsons Blvd
- 144-20 Summit Place
- 2 Summit Place
- 88 Parsons Blvd
- 417 Parsons Blvd
- 2 Summit Place
- 417 Parsons Blvd
- 2 Summit Place
- 512 Parsons Blvd
- 512 Parsons Blvd Unit House
- 512 Parsons Blvd
- 1 Summit Place
- 1 Summit Place Unit Building
- 86 Parsons Blvd
- 605 Parsons Blvd
Your Personal Tour Guide
Ask me questions while you tour the home.