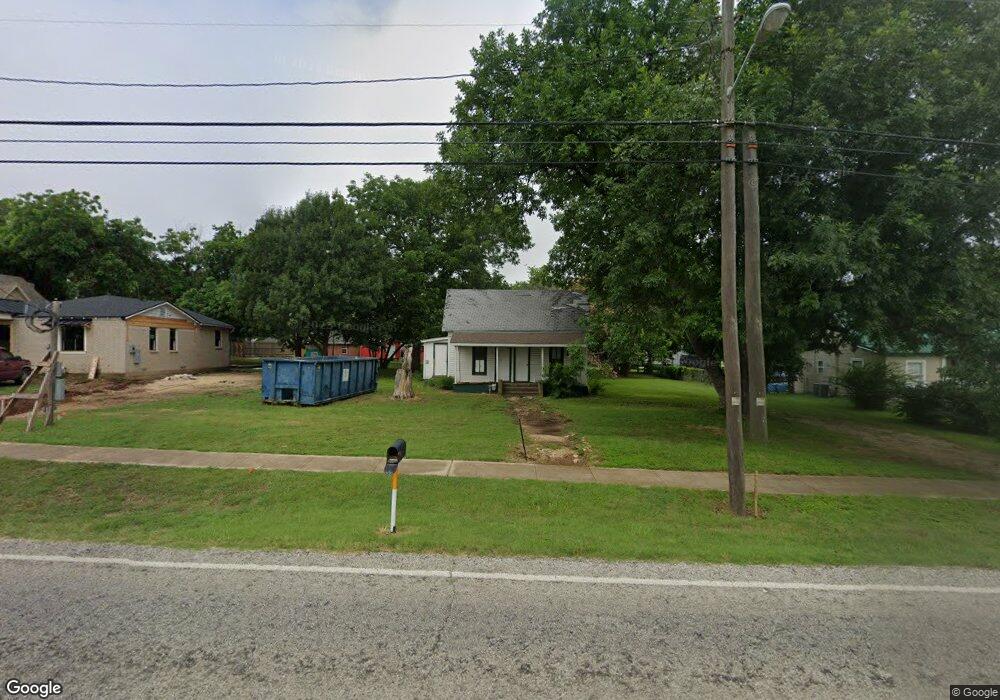
503 S 9th St Midlothian, TX 76065
Estimated Value: $210,464 - $340,000
2
Beds
1
Bath
1,010
Sq Ft
$273/Sq Ft
Est. Value
About This Home
This home is located at 503 S 9th St, Midlothian, TX 76065 and is currently estimated at $275,232, approximately $272 per square foot. 503 S 9th St is a home located in Ellis County with nearby schools including Irvin Elementary School and Frank Seale Middle School.
Ownership History
Date
Name
Owned For
Owner Type
Purchase Details
Closed on
Sep 12, 2025
Sold by
Mentzel Family First Limited Partnership
Bought by
Blue Chip Partners Llc
Current Estimated Value
Purchase Details
Closed on
Sep 20, 2023
Sold by
Oglesby Joyce Faye
Bought by
Mentzel Family First Limited Partnership
Home Financials for this Owner
Home Financials are based on the most recent Mortgage that was taken out on this home.
Original Mortgage
$100,000
Interest Rate
6.96%
Mortgage Type
New Conventional
Create a Home Valuation Report for This Property
The Home Valuation Report is an in-depth analysis detailing your home's value as well as a comparison with similar homes in the area
Home Values in the Area
Average Home Value in this Area
Purchase History
| Date | Buyer | Sale Price | Title Company |
|---|---|---|---|
| Blue Chip Partners Llc | -- | None Listed On Document | |
| Mentzel Family First Limited Partnership | -- | None Listed On Document | |
| Mentzel Family First Limited Partnership | -- | None Listed On Document |
Source: Public Records
Mortgage History
| Date | Status | Borrower | Loan Amount |
|---|---|---|---|
| Previous Owner | Mentzel Family First Limited Partnership | $100,000 |
Source: Public Records
Tax History Compared to Growth
Tax History
| Year | Tax Paid | Tax Assessment Tax Assessment Total Assessment is a certain percentage of the fair market value that is determined by local assessors to be the total taxable value of land and additions on the property. | Land | Improvement |
|---|---|---|---|---|
| 2025 | $2,522 | $120,000 | $90,000 | $30,000 |
| 2024 | $2,522 | $125,000 | $90,000 | $35,000 |
| 2023 | $2,522 | $204,104 | $80,000 | $124,104 |
| 2022 | $3,316 | $148,009 | $45,000 | $103,009 |
| 2021 | $2,921 | $123,420 | $33,750 | $89,670 |
| 2020 | $2,916 | $115,920 | $33,750 | $82,170 |
| 2019 | $1,234 | $47,130 | $0 | $0 |
| 2018 | $1,252 | $47,820 | $22,000 | $25,820 |
| 2017 | $1,242 | $46,650 | $22,000 | $24,650 |
| 2016 | $1,242 | $46,650 | $22,000 | $24,650 |
| 2015 | $1,271 | $47,030 | $22,000 | $25,030 |
| 2014 | $1,271 | $47,760 | $0 | $0 |
Source: Public Records
Map
Nearby Homes