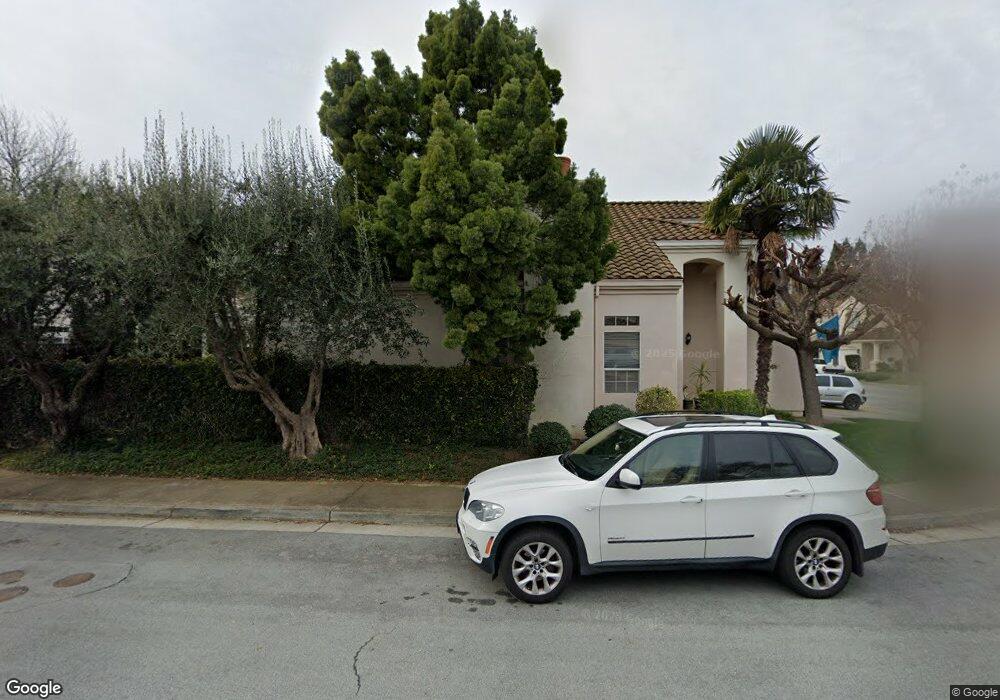
503 Via Sorrento Morgan Hill, CA 95037
Estimated Value: $1,259,000 - $1,421,000
4
Beds
3
Baths
2,408
Sq Ft
$553/Sq Ft
Est. Value
About This Home
This home is located at 503 Via Sorrento, Morgan Hill, CA 95037 and is currently estimated at $1,331,606, approximately $552 per square foot. 503 Via Sorrento is a home located in Santa Clara County with nearby schools including Paradise Valley Elementary, Britton Middle School, and Ann Sobrato High School.
Ownership History
Date
Name
Owned For
Owner Type
Purchase Details
Closed on
Mar 6, 2001
Sold by
Staples Robert G and Staples Tamara C
Bought by
Bacciarelli Jacek and Bacciarelli Violetta
Current Estimated Value
Home Financials for this Owner
Home Financials are based on the most recent Mortgage that was taken out on this home.
Original Mortgage
$430,500
Outstanding Balance
$160,859
Interest Rate
7.37%
Estimated Equity
$1,170,747
Purchase Details
Closed on
Aug 24, 1998
Sold by
Staples Robert G and Staples Tamara C
Bought by
Staples Robert G and Staples Tamara C
Purchase Details
Closed on
Mar 18, 1996
Sold by
Galbavy James A and Galbavy Mary E
Bought by
Staples Robert G and Staples Tamara C
Home Financials for this Owner
Home Financials are based on the most recent Mortgage that was taken out on this home.
Original Mortgage
$244,000
Interest Rate
6.87%
Create a Home Valuation Report for This Property
The Home Valuation Report is an in-depth analysis detailing your home's value as well as a comparison with similar homes in the area
Home Values in the Area
Average Home Value in this Area
Purchase History
| Date | Buyer | Sale Price | Title Company |
|---|---|---|---|
| Bacciarelli Jacek | $574,000 | Old Republic Title Company | |
| Staples Robert G | -- | -- | |
| Staples Robert G | $305,000 | Stewart Title |
Source: Public Records
Mortgage History
| Date | Status | Borrower | Loan Amount |
|---|---|---|---|
| Open | Bacciarelli Jacek | $430,500 | |
| Previous Owner | Staples Robert G | $244,000 | |
| Closed | Staples Robert G | $30,500 |
Source: Public Records
Tax History Compared to Growth
Tax History
| Year | Tax Paid | Tax Assessment Tax Assessment Total Assessment is a certain percentage of the fair market value that is determined by local assessors to be the total taxable value of land and additions on the property. | Land | Improvement |
|---|---|---|---|---|
| 2025 | $9,684 | $864,903 | $345,959 | $518,944 |
| 2024 | $9,684 | $847,945 | $339,176 | $508,769 |
| 2023 | $9,558 | $831,320 | $332,526 | $498,794 |
| 2022 | $9,397 | $815,020 | $326,006 | $489,014 |
| 2021 | $9,161 | $799,040 | $319,614 | $479,426 |
| 2020 | $8,938 | $790,848 | $316,337 | $474,511 |
| 2019 | $9,190 | $775,342 | $310,135 | $465,207 |
| 2018 | $9,217 | $760,140 | $304,054 | $456,086 |
| 2017 | $9,129 | $745,237 | $298,093 | $447,144 |
| 2016 | $8,550 | $730,626 | $292,249 | $438,377 |
| 2015 | $8,457 | $719,653 | $287,860 | $431,793 |
| 2014 | $8,579 | $705,557 | $282,222 | $423,335 |
Source: Public Records
Map
Nearby Homes
- 507 Via Sorrento
- 542 Via Sorrento
- 605 Encino Dr
- 15180 Venetian Way
- 15120 Venetian Way
- 15145 Bellini Way
- 136 Vinewood Ln Unit 136
- 140 La Crosse Dr
- 14668 Excaliber Ct
- 199 Leisure Dr Unit 199
- 97 Melody Ln Unit 97
- 92 Melody Ln Unit 92
- 56 Creekside Dr Unit 56
- 42 Dewey Cir
- 14515 Shadowlane Ct
- 1020 Brookview Ct
- 407 Scotts Bluff Place
- 15209 Sycamore Dr
- 0 Seymour Ave Unit 225017465
- 14430 Monterey Hwy
- 505 Via Sorrento
- 481 Via Sorrento
- 494 Via Sorrento
- 479 Via Sorrento
- 492 Via Sorrento
- 509 Via Sorrento
- 504 Via Sorrento
- 496 Via Sorrento
- 502 Via Sorrento
- 506 Via Sorrento
- 490 Via Sorrento
- 500 Via Sorrento
- 508 Via Sorrento
- 498 Via Sorrento
- 488 Via Sorrento
- 513 Via Sorrento
- 510 Via Sorrento
- 482 Via Sorrento
- 486 Via Sorrento
- 484 Via Sorrento