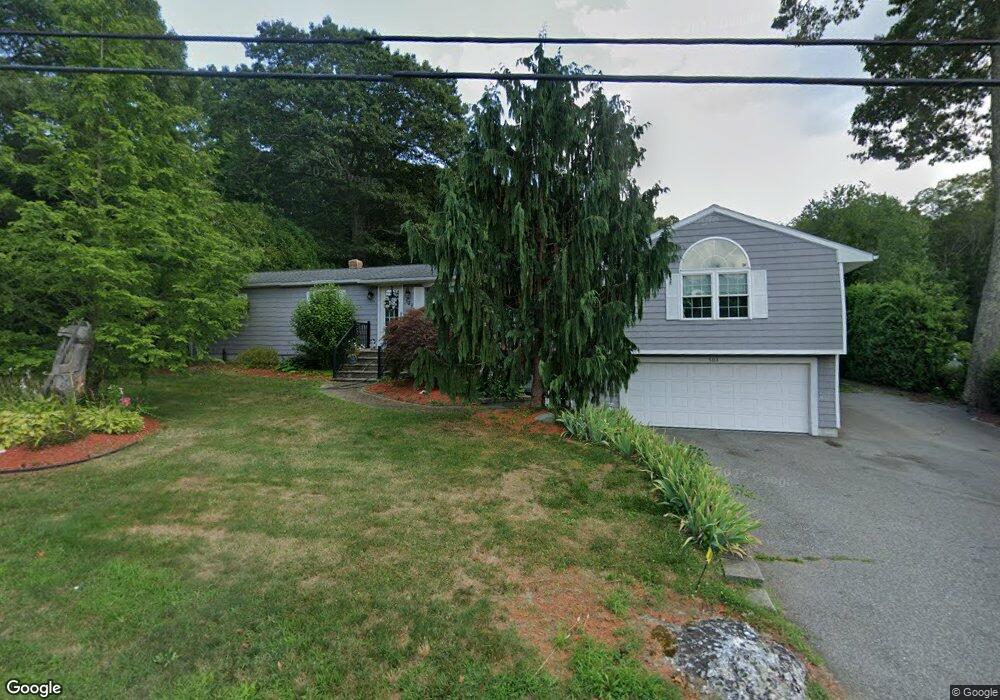
503 Vinnicum Rd Swansea, MA 02777
West Swansea NeighborhoodEstimated Value: $552,000 - $666,000
3
Beds
2
Baths
1,742
Sq Ft
$350/Sq Ft
Est. Value
About This Home
This home is located at 503 Vinnicum Rd, Swansea, MA 02777 and is currently estimated at $608,942, approximately $349 per square foot. 503 Vinnicum Rd is a home located in Bristol County with nearby schools including Joseph Case High School and Highlander Charter Middle and High School.
Ownership History
Date
Name
Owned For
Owner Type
Purchase Details
Closed on
Aug 26, 2016
Sold by
Levesque Alan P
Bought by
Levesque Alan P and Levesque Sharon
Current Estimated Value
Home Financials for this Owner
Home Financials are based on the most recent Mortgage that was taken out on this home.
Original Mortgage
$268,111
Outstanding Balance
$213,506
Interest Rate
3.42%
Mortgage Type
FHA
Estimated Equity
$395,436
Purchase Details
Closed on
Sep 27, 2013
Sold by
Levesque Julie A and Levesque Alan P
Bought by
Levesque Alan P
Home Financials for this Owner
Home Financials are based on the most recent Mortgage that was taken out on this home.
Original Mortgage
$254,000
Interest Rate
4.42%
Mortgage Type
New Conventional
Purchase Details
Closed on
Aug 30, 1991
Sold by
Charest Susan M C
Bought by
Levesque Alan P and Levesque Juloie Ann
Create a Home Valuation Report for This Property
The Home Valuation Report is an in-depth analysis detailing your home's value as well as a comparison with similar homes in the area
Home Values in the Area
Average Home Value in this Area
Purchase History
| Date | Buyer | Sale Price | Title Company |
|---|---|---|---|
| Levesque Alan P | -- | -- | |
| Levesque Alan P | -- | -- | |
| Levesque Alan P | $123,000 | -- |
Source: Public Records
Mortgage History
| Date | Status | Borrower | Loan Amount |
|---|---|---|---|
| Open | Levesque Alan P | $268,111 | |
| Previous Owner | Levesque Alan P | $254,000 | |
| Previous Owner | Levesque Alan P | $100,000 | |
| Previous Owner | Levesque Alan P | $152,000 |
Source: Public Records
Tax History Compared to Growth
Tax History
| Year | Tax Paid | Tax Assessment Tax Assessment Total Assessment is a certain percentage of the fair market value that is determined by local assessors to be the total taxable value of land and additions on the property. | Land | Improvement |
|---|---|---|---|---|
| 2025 | $5,984 | $502,000 | $176,000 | $326,000 |
| 2024 | $5,959 | $497,000 | $176,000 | $321,000 |
| 2023 | $5,731 | $436,500 | $129,100 | $307,400 |
| 2022 | $5,674 | $394,300 | $117,400 | $276,900 |
| 2021 | $5,197 | $332,500 | $117,400 | $215,100 |
| 2020 | $5,297 | $340,000 | $117,400 | $222,600 |
| 2019 | $5,078 | $327,400 | $104,800 | $222,600 |
| 2018 | $4,874 | $319,000 | $103,100 | $215,900 |
| 2017 | $4,236 | $319,000 | $103,100 | $215,900 |
| 2016 | $4,113 | $304,200 | $95,600 | $208,600 |
| 2015 | $3,753 | $285,800 | $95,600 | $190,200 |
| 2014 | $3,698 | $288,000 | $95,600 | $192,400 |
Source: Public Records
Map
Nearby Homes