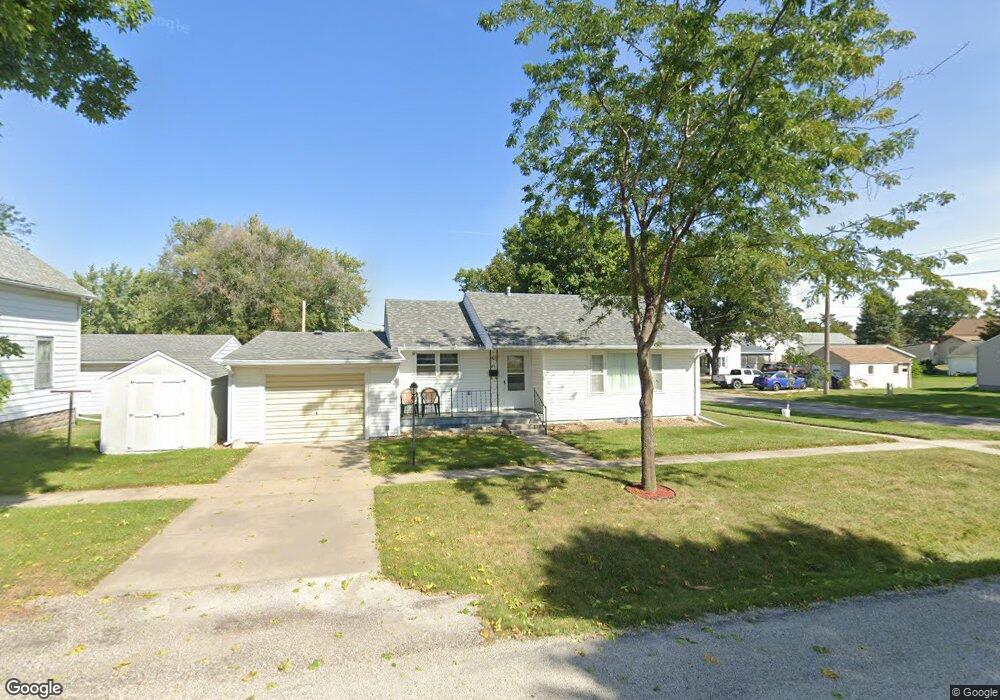
503 W 12th St Vinton, IA 52349
Estimated Value: $127,000 - $154,000
2
Beds
5
Baths
1,058
Sq Ft
$133/Sq Ft
Est. Value
About This Home
This home is located at 503 W 12th St, Vinton, IA 52349 and is currently estimated at $140,866, approximately $133 per square foot. 503 W 12th St is a home located in Benton County with nearby schools including Tilford Elementary School, Shellsburg Elementary School, and Vinton-Shellsburg Middle School.
Ownership History
Date
Name
Owned For
Owner Type
Purchase Details
Closed on
May 16, 2006
Sold by
Levelle Leonard
Bought by
Anderson Matthew G
Current Estimated Value
Home Financials for this Owner
Home Financials are based on the most recent Mortgage that was taken out on this home.
Original Mortgage
$58,500
Outstanding Balance
$34,151
Interest Rate
6.54%
Mortgage Type
New Conventional
Estimated Equity
$106,715
Create a Home Valuation Report for This Property
The Home Valuation Report is an in-depth analysis detailing your home's value as well as a comparison with similar homes in the area
Home Values in the Area
Average Home Value in this Area
Purchase History
| Date | Buyer | Sale Price | Title Company |
|---|---|---|---|
| Anderson Matthew G | $65,000 | None Available |
Source: Public Records
Mortgage History
| Date | Status | Borrower | Loan Amount |
|---|---|---|---|
| Open | Anderson Matthew G | $58,500 |
Source: Public Records
Tax History Compared to Growth
Tax History
| Year | Tax Paid | Tax Assessment Tax Assessment Total Assessment is a certain percentage of the fair market value that is determined by local assessors to be the total taxable value of land and additions on the property. | Land | Improvement |
|---|---|---|---|---|
| 2025 | $1,866 | $118,800 | $14,400 | $104,400 |
| 2024 | $1,866 | $109,800 | $14,400 | $95,400 |
| 2023 | $1,786 | $109,800 | $14,400 | $95,400 |
| 2022 | $1,832 | $91,900 | $11,500 | $80,400 |
| 2021 | $1,832 | $91,900 | $11,500 | $80,400 |
| 2020 | $1,362 | $71,700 | $9,800 | $61,900 |
| 2019 | $1,378 | $71,700 | $9,800 | $61,900 |
| 2018 | $1,334 | $71,400 | $9,200 | $62,200 |
| 2017 | $1,334 | $71,400 | $9,200 | $62,200 |
| 2016 | $1,252 | $66,700 | $8,600 | $58,100 |
| 2015 | $1,252 | $66,700 | $8,600 | $58,100 |
| 2014 | $1,370 | $72,100 | $0 | $0 |
Source: Public Records
Map
Nearby Homes