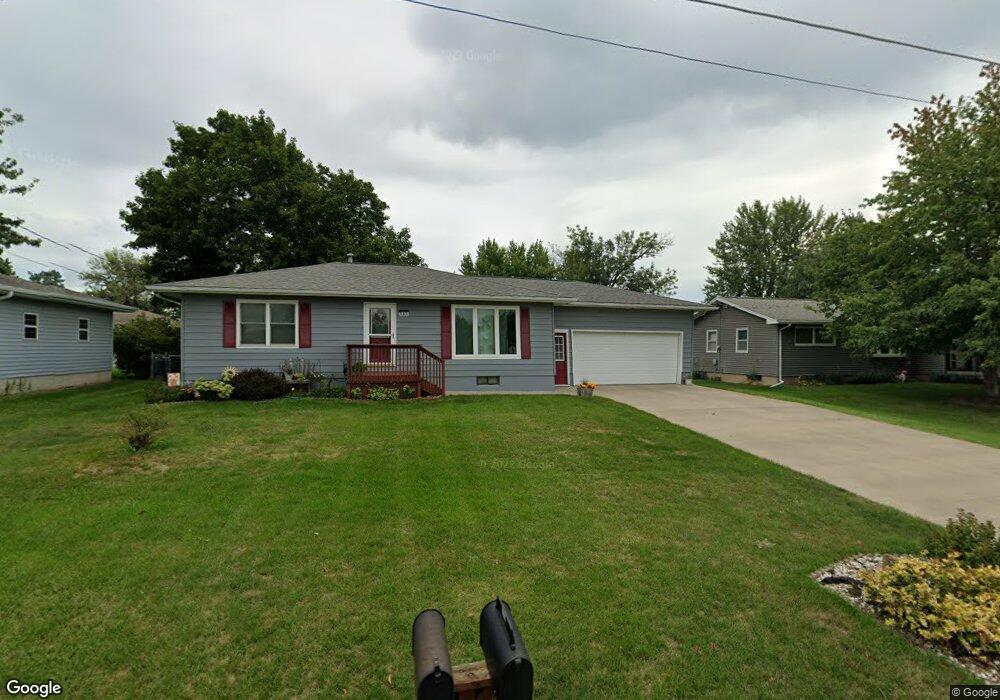
503 W 17th St Vinton, IA 52349
Estimated Value: $194,073 - $235,000
4
Beds
2
Baths
1,064
Sq Ft
$202/Sq Ft
Est. Value
About This Home
This home is located at 503 W 17th St, Vinton, IA 52349 and is currently estimated at $215,018, approximately $202 per square foot. 503 W 17th St is a home located in Benton County with nearby schools including Tilford Elementary School, Shellsburg Elementary School, and Vinton-Shellsburg Middle School.
Ownership History
Date
Name
Owned For
Owner Type
Purchase Details
Closed on
Oct 30, 2013
Sold by
Zelle Beth A
Bought by
Walston William G and Walston Diane M
Current Estimated Value
Home Financials for this Owner
Home Financials are based on the most recent Mortgage that was taken out on this home.
Original Mortgage
$102,800
Outstanding Balance
$25,521
Interest Rate
3.34%
Mortgage Type
New Conventional
Estimated Equity
$189,497
Purchase Details
Closed on
Feb 15, 2012
Sold by
Coder Ross T and Coder Crystal A
Bought by
Zelle Beth A
Home Financials for this Owner
Home Financials are based on the most recent Mortgage that was taken out on this home.
Original Mortgage
$100,000
Interest Rate
3.91%
Mortgage Type
New Conventional
Create a Home Valuation Report for This Property
The Home Valuation Report is an in-depth analysis detailing your home's value as well as a comparison with similar homes in the area
Home Values in the Area
Average Home Value in this Area
Purchase History
| Date | Buyer | Sale Price | Title Company |
|---|---|---|---|
| Walston William G | $128,500 | None Available | |
| Zelle Beth A | $125,000 | None Available |
Source: Public Records
Mortgage History
| Date | Status | Borrower | Loan Amount |
|---|---|---|---|
| Open | Walston William G | $102,800 | |
| Previous Owner | Zelle Beth A | $100,000 |
Source: Public Records
Tax History Compared to Growth
Tax History
| Year | Tax Paid | Tax Assessment Tax Assessment Total Assessment is a certain percentage of the fair market value that is determined by local assessors to be the total taxable value of land and additions on the property. | Land | Improvement |
|---|---|---|---|---|
| 2025 | $2,542 | $177,100 | $24,600 | $152,500 |
| 2024 | $2,542 | $159,600 | $24,200 | $135,400 |
| 2023 | $2,592 | $159,600 | $24,200 | $135,400 |
| 2022 | $2,658 | $129,300 | $19,300 | $110,000 |
| 2021 | $2,658 | $129,300 | $19,300 | $110,000 |
| 2020 | $2,478 | $123,300 | $16,700 | $106,600 |
| 2019 | $2,454 | $123,300 | $16,700 | $106,600 |
| 2018 | $2,380 | $120,500 | $16,100 | $104,400 |
| 2017 | $2,284 | $120,500 | $16,100 | $104,400 |
| 2016 | $2,242 | $112,600 | $15,000 | $97,600 |
| 2015 | $2,242 | $112,600 | $15,000 | $97,600 |
| 2014 | $2,268 | $113,600 | $0 | $0 |
Source: Public Records
Map
Nearby Homes