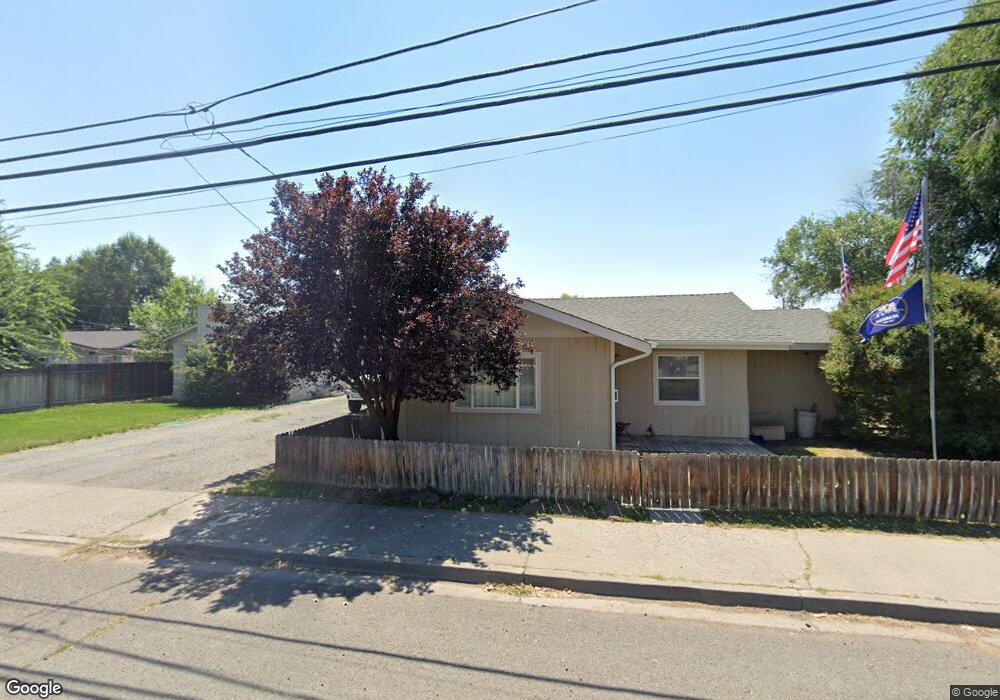
503 W 4th St Unit 505 Alturas, CA 96101
Estimated Value: $119,189 - $168,000
1
Bed
1
Bath
1,114
Sq Ft
$125/Sq Ft
Est. Value
About This Home
This home is located at 503 W 4th St Unit 505, Alturas, CA 96101 and is currently estimated at $139,297, approximately $125 per square foot. 503 W 4th St Unit 505 is a home located in Modoc County with nearby schools including Modoc High School and New Day Academy.
Ownership History
Date
Name
Owned For
Owner Type
Purchase Details
Closed on
Oct 7, 2025
Sold by
Rouse Becky L
Bought by
Rouse Dean G
Current Estimated Value
Home Financials for this Owner
Home Financials are based on the most recent Mortgage that was taken out on this home.
Original Mortgage
$154,000
Outstanding Balance
$154,000
Interest Rate
6.5%
Mortgage Type
New Conventional
Estimated Equity
-$14,703
Purchase Details
Closed on
May 16, 2003
Sold by
Dorris Roger D and Dorris Connie J
Bought by
Rouse Dean G and Rouse Becky L
Home Financials for this Owner
Home Financials are based on the most recent Mortgage that was taken out on this home.
Original Mortgage
$62,000
Interest Rate
5.75%
Mortgage Type
Seller Take Back
Create a Home Valuation Report for This Property
The Home Valuation Report is an in-depth analysis detailing your home's value as well as a comparison with similar homes in the area
Home Values in the Area
Average Home Value in this Area
Purchase History
| Date | Buyer | Sale Price | Title Company |
|---|---|---|---|
| Rouse Dean G | -- | Chicago Title | |
| Rouse Dean G | $65,000 | Modoc County Title Co |
Source: Public Records
Mortgage History
| Date | Status | Borrower | Loan Amount |
|---|---|---|---|
| Open | Rouse Dean G | $154,000 | |
| Previous Owner | Rouse Dean G | $62,000 |
Source: Public Records
Tax History
| Year | Tax Paid | Tax Assessment Tax Assessment Total Assessment is a certain percentage of the fair market value that is determined by local assessors to be the total taxable value of land and additions on the property. | Land | Improvement |
|---|---|---|---|---|
| 2025 | $1,215 | $100,199 | $9,547 | $90,652 |
| 2024 | $1,215 | $98,235 | $9,360 | $88,875 |
| 2023 | $1,196 | $96,310 | $9,177 | $87,133 |
| 2022 | $1,177 | $94,423 | $8,998 | $85,425 |
| 2021 | $1,159 | $92,572 | $8,822 | $83,750 |
| 2020 | $1,149 | $91,624 | $8,732 | $82,892 |
| 2019 | $1,131 | $89,828 | $8,561 | $81,267 |
| 2018 | $993 | $76,000 | $11,515 | $64,485 |
| 2017 | $993 | $76,000 | $11,515 | $64,485 |
| 2016 | $993 | $76,000 | $11,515 | $64,485 |
| 2015 | $993 | $76,000 | $11,515 | $64,485 |
| 2014 | $993 | $76,000 | $11,515 | $64,485 |
Source: Public Records
Map
Nearby Homes
Your Personal Tour Guide
Ask me questions while you tour the home.