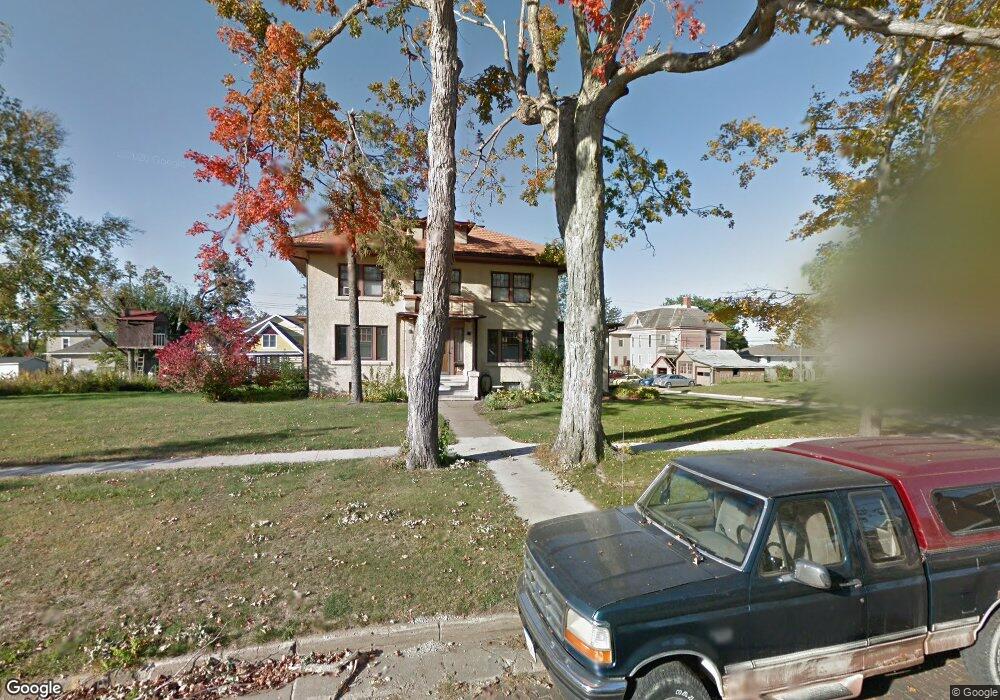
503 W 6th St Vinton, IA 52349
Estimated Value: $245,000 - $268,111
3
Beds
3
Baths
2,244
Sq Ft
$113/Sq Ft
Est. Value
About This Home
This home is located at 503 W 6th St, Vinton, IA 52349 and is currently estimated at $252,778, approximately $112 per square foot. 503 W 6th St is a home located in Benton County with nearby schools including Tilford Elementary School, Vinton-Shellsburg Middle School, and Vinton-Shellsburg High School.
Ownership History
Date
Name
Owned For
Owner Type
Purchase Details
Closed on
May 11, 2023
Sold by
Goeke David L
Bought by
Becicka Shirley L
Current Estimated Value
Purchase Details
Closed on
Jun 10, 2015
Sold by
Goeke David L
Bought by
Goeke David L and Becicka Shirley L
Home Financials for this Owner
Home Financials are based on the most recent Mortgage that was taken out on this home.
Original Mortgage
$134,900
Interest Rate
3.77%
Mortgage Type
New Conventional
Purchase Details
Closed on
Apr 29, 2015
Sold by
Siemsen Richard and Siemsen Annette
Bought by
Goeke David L and Becicka Shirley L
Home Financials for this Owner
Home Financials are based on the most recent Mortgage that was taken out on this home.
Original Mortgage
$134,900
Interest Rate
3.77%
Mortgage Type
New Conventional
Create a Home Valuation Report for This Property
The Home Valuation Report is an in-depth analysis detailing your home's value as well as a comparison with similar homes in the area
Home Values in the Area
Average Home Value in this Area
Purchase History
| Date | Buyer | Sale Price | Title Company |
|---|---|---|---|
| Becicka Shirley L | -- | None Listed On Document | |
| Goeke David L | -- | None Available | |
| Goeke David L | -- | None Available | |
| Goeke David L | -- | None Available |
Source: Public Records
Mortgage History
| Date | Status | Borrower | Loan Amount |
|---|---|---|---|
| Previous Owner | Goeke David L | $134,900 |
Source: Public Records
Tax History
| Year | Tax Paid | Tax Assessment Tax Assessment Total Assessment is a certain percentage of the fair market value that is determined by local assessors to be the total taxable value of land and additions on the property. | Land | Improvement |
|---|---|---|---|---|
| 2025 | $4,456 | $284,600 | $25,700 | $258,900 |
| 2024 | $4,456 | $270,200 | $24,600 | $245,600 |
| 2023 | $6,050 | $270,200 | $24,600 | $245,600 |
| 2022 | $6,208 | $293,400 | $19,700 | $273,700 |
| 2021 | $6,208 | $293,400 | $19,700 | $273,700 |
| 2020 | $6,194 | $238,300 | $25,700 | $212,600 |
| 2019 | $6,312 | $298,400 | $25,700 | $272,700 |
| 2018 | $6,126 | $299,700 | $24,700 | $275,000 |
| 2017 | $6,126 | $299,700 | $24,700 | $275,000 |
| 2016 | $3,550 | $280,100 | $23,100 | $257,000 |
| 2015 | $3,550 | $152,900 | $11,600 | $141,300 |
| 2014 | $2,826 | $139,400 | $0 | $0 |
Source: Public Records
Map
Nearby Homes
Your Personal Tour Guide
Ask me questions while you tour the home.