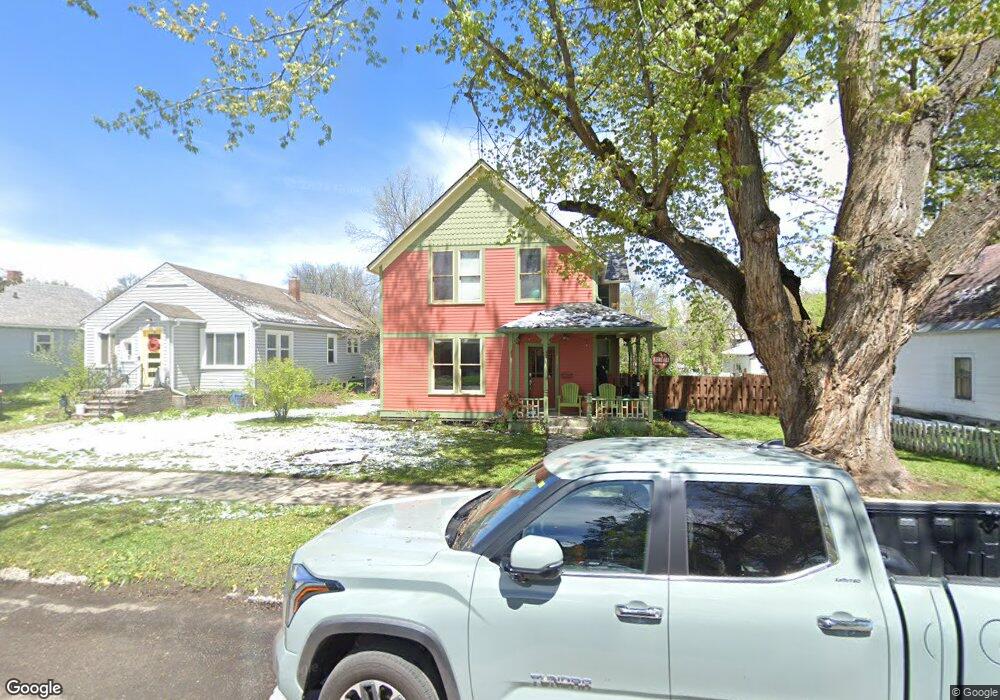
503 W Olive St Bozeman, MT 59715
Cooper Park NeighborhoodEstimated Value: $1,075,171 - $1,257,000
5
Beds
2
Baths
3,003
Sq Ft
$378/Sq Ft
Est. Value
About This Home
This home is located at 503 W Olive St, Bozeman, MT 59715 and is currently estimated at $1,136,293, approximately $378 per square foot. 503 W Olive St is a home located in Gallatin County with nearby schools including Irving Elementary School, Van Cortlandtville School, and Thomas Jefferson Elementary School.
Ownership History
Date
Name
Owned For
Owner Type
Purchase Details
Closed on
Aug 25, 2011
Sold by
Alexander Dennis C and Velazquez Tracy E
Bought by
Driscoll Karen Cornelia
Current Estimated Value
Home Financials for this Owner
Home Financials are based on the most recent Mortgage that was taken out on this home.
Original Mortgage
$250,000
Outstanding Balance
$171,342
Interest Rate
4.43%
Mortgage Type
New Conventional
Estimated Equity
$964,951
Create a Home Valuation Report for This Property
The Home Valuation Report is an in-depth analysis detailing your home's value as well as a comparison with similar homes in the area
Home Values in the Area
Average Home Value in this Area
Purchase History
| Date | Buyer | Sale Price | Title Company |
|---|---|---|---|
| Driscoll Karen Cornelia | -- | Mountain West Title |
Source: Public Records
Mortgage History
| Date | Status | Borrower | Loan Amount |
|---|---|---|---|
| Open | Driscoll Karen Cornelia | $250,000 |
Source: Public Records
Tax History Compared to Growth
Tax History
| Year | Tax Paid | Tax Assessment Tax Assessment Total Assessment is a certain percentage of the fair market value that is determined by local assessors to be the total taxable value of land and additions on the property. | Land | Improvement |
|---|---|---|---|---|
| 2025 | $5,037 | $1,022,400 | $0 | $0 |
| 2024 | $6,635 | $996,700 | $0 | $0 |
| 2023 | $6,410 | $996,700 | $0 | $0 |
| 2022 | $4,984 | $649,900 | $0 | $0 |
| 2021 | $5,500 | $649,900 | $0 | $0 |
| 2020 | $4,701 | $551,200 | $0 | $0 |
| 2019 | $4,809 | $551,200 | $0 | $0 |
| 2018 | $4,444 | $472,000 | $0 | $0 |
| 2017 | $4,401 | $472,000 | $0 | $0 |
| 2016 | $3,938 | $418,100 | $0 | $0 |
| 2015 | $3,942 | $418,100 | $0 | $0 |
| 2014 | $3,871 | $241,680 | $0 | $0 |
Source: Public Records
Map
Nearby Homes
- 418 W Babcock St
- 414 W Babcock St Unit 2
- 425 W Olive St
- 516 W Olive St
- 300 W Main St Unit G
- 300 W Main St Unit Q
- 221 S 7th Ave
- 401 S Grand Ave
- 37 W Main St Unit A
- 5 W Mendenhall St Unit 414
- 5 W Mendenhall St Unit 510
- 5 W Mendenhall St Unit 410
- 5 W Mendenhall St Unit 415
- 507 S 8th Ave
- 420 N 6th Ave
- 421 N Grand Ave
- 315 N Tracy Ave Unit 207
- 315 N Tracy Ave Unit 106
- 315 N Tracy Ave Unit 403
- 315 N Tracy Ave Unit 604
- 505 W Olive St
- 429 W Olive St
- 509 W Olive St
- 421 W Olive St
- 201 S 5th Ave
- 515 W Olive St
- 502 W Babcock St
- 506 W Babcock St
- 510 W Olive St
- 428 W Babcock St
- 510 W Babcock St
- 426 W Babcock St
- 506 and 506 1/2 W Babcock
- 417 W Olive St
- 205 S 5th Ave
- 204 S 5th Ave
- 428 W Babcock St
- 428 W Babcock St
- 426 and 428 W Babcock
- 426 W Babcock St