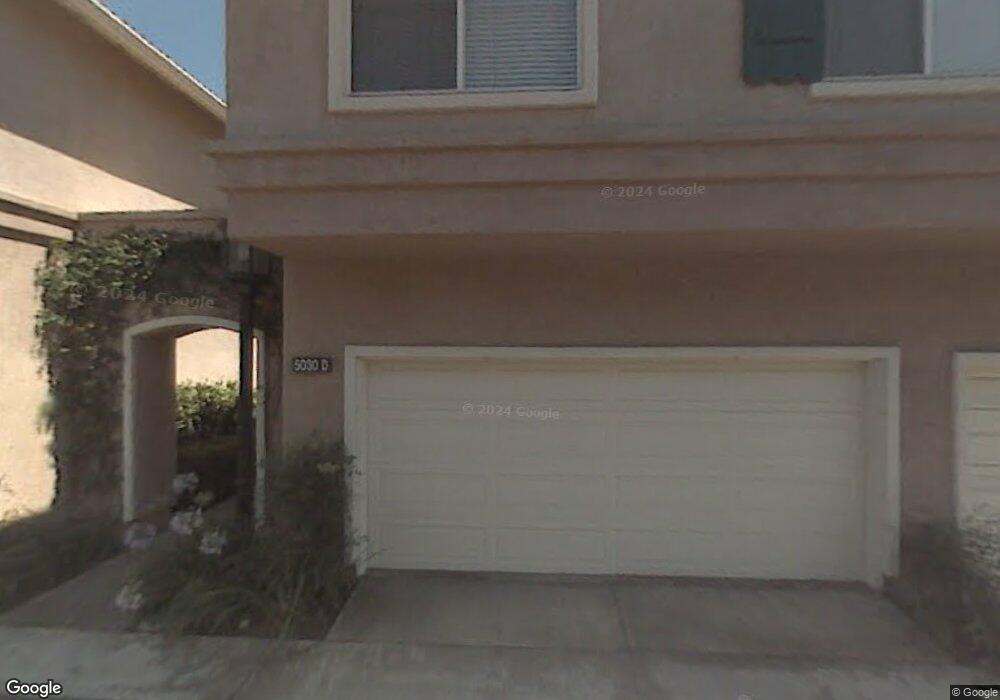
5030 E Tenderrow Place Unit C Orange, CA 92867
Estimated Value: $823,738 - $856,000
3
Beds
3
Baths
1,415
Sq Ft
$596/Sq Ft
Est. Value
About This Home
This home is located at 5030 E Tenderrow Place Unit C, Orange, CA 92867 and is currently estimated at $842,935, approximately $595 per square foot. 5030 E Tenderrow Place Unit C is a home located in Orange County with nearby schools including Nohl Canyon Elementary School, Cerro Villa Middle School, and Villa Park High School.
Ownership History
Date
Name
Owned For
Owner Type
Purchase Details
Closed on
Jul 24, 2017
Sold by
Newton Craig E and Newton Patricia G
Bought by
Newton Craig E and Newton Patricia G
Current Estimated Value
Purchase Details
Closed on
Nov 6, 2002
Sold by
Newton Patricia G and Kirkbride Patricia G
Bought by
Newton Craig E and Newton Patricia G
Home Financials for this Owner
Home Financials are based on the most recent Mortgage that was taken out on this home.
Original Mortgage
$139,600
Interest Rate
5.86%
Purchase Details
Closed on
Apr 30, 1996
Sold by
Pacific Ridge Partners
Bought by
Kirkbride Patricia G
Home Financials for this Owner
Home Financials are based on the most recent Mortgage that was taken out on this home.
Original Mortgage
$154,850
Interest Rate
7.97%
Mortgage Type
FHA
Create a Home Valuation Report for This Property
The Home Valuation Report is an in-depth analysis detailing your home's value as well as a comparison with similar homes in the area
Home Values in the Area
Average Home Value in this Area
Purchase History
| Date | Buyer | Sale Price | Title Company |
|---|---|---|---|
| Newton Craig E | -- | None Available | |
| Newton Craig E | -- | Southland Title Corporation | |
| Kirkbride Patricia G | $162,000 | First American Title Ins |
Source: Public Records
Mortgage History
| Date | Status | Borrower | Loan Amount |
|---|---|---|---|
| Closed | Newton Craig E | $139,600 | |
| Closed | Kirkbride Patricia G | $154,850 |
Source: Public Records
Tax History
| Year | Tax Paid | Tax Assessment Tax Assessment Total Assessment is a certain percentage of the fair market value that is determined by local assessors to be the total taxable value of land and additions on the property. | Land | Improvement |
|---|---|---|---|---|
| 2025 | $3,101 | $268,945 | $52,281 | $216,664 |
| 2024 | $3,101 | $263,672 | $51,256 | $212,416 |
| 2023 | $3,028 | $258,502 | $50,251 | $208,251 |
| 2022 | $2,966 | $253,434 | $49,266 | $204,168 |
| 2021 | $2,885 | $248,465 | $48,300 | $200,165 |
| 2020 | $2,858 | $245,918 | $47,805 | $198,113 |
| 2019 | $2,823 | $241,097 | $46,868 | $194,229 |
| 2018 | $2,779 | $236,370 | $45,949 | $190,421 |
| 2017 | $2,669 | $231,736 | $45,048 | $186,688 |
| 2016 | $2,617 | $227,193 | $44,165 | $183,028 |
| 2015 | $2,578 | $223,781 | $43,502 | $180,279 |
| 2014 | $2,522 | $219,398 | $42,650 | $176,748 |
Source: Public Records
Map
Nearby Homes
- 656 S Andover Dr
- 5598 E Stetson Ct Unit 22
- 640 S Londerry Ln
- 18782 Peppertree Dr
- 9312 Smoketree Ln
- 5447 E Willowick Cir
- 595 S Avenida Faro
- 415 S Brook Ln
- 420 S Rolling Hills Place
- 18605 Villa Dr
- 0 Cannon St
- 5810 E Mountain Loop Trail Unit 35
- 4011 E Green Clover Cir
- 3624 E Shallow Brook Ln
- 9531 Lemon St
- 18811 Ridgeview Cir
- 5573 E Vista Del Rio
- 230 S Plaza de Domingos
- 5640 E Plaza de Amantes
- 5489 E Suncrest Rd
- 5030 E Tenderrow Place Unit A
- 5030 E Tenderrow Place Unit F
- 5030 E Tenderrow Place Unit B
- 5030 E Tenderrow Place Unit D
- 5030 E Tenderrow Place Unit E
- 5040 E Hunsford Dr Unit B
- 5040 E Hunsford Dr Unit A
- 5040 E Hunsford Dr Unit C
- 2772 N Blackburn Dr Unit A
- 2772 N Blackburn Dr
- 2772 N Blackburn Dr Unit C
- 2772 N Blackburn Dr Unit D
- 2772 N Blackburn Dr Unit F
- 2772 N Blackburn Dr Unit E
- 2772 N Blackburn Dr Unit B
- 5029 E Tenderrow Place Unit C
- 5029 E Tenderrow Place Unit B
- 5029 E Tenderrow Place Unit E
- 5029 E Tenderrow Place Unit F
- 5029 E Tenderrow Place Unit A
Your Personal Tour Guide
Ask me questions while you tour the home.