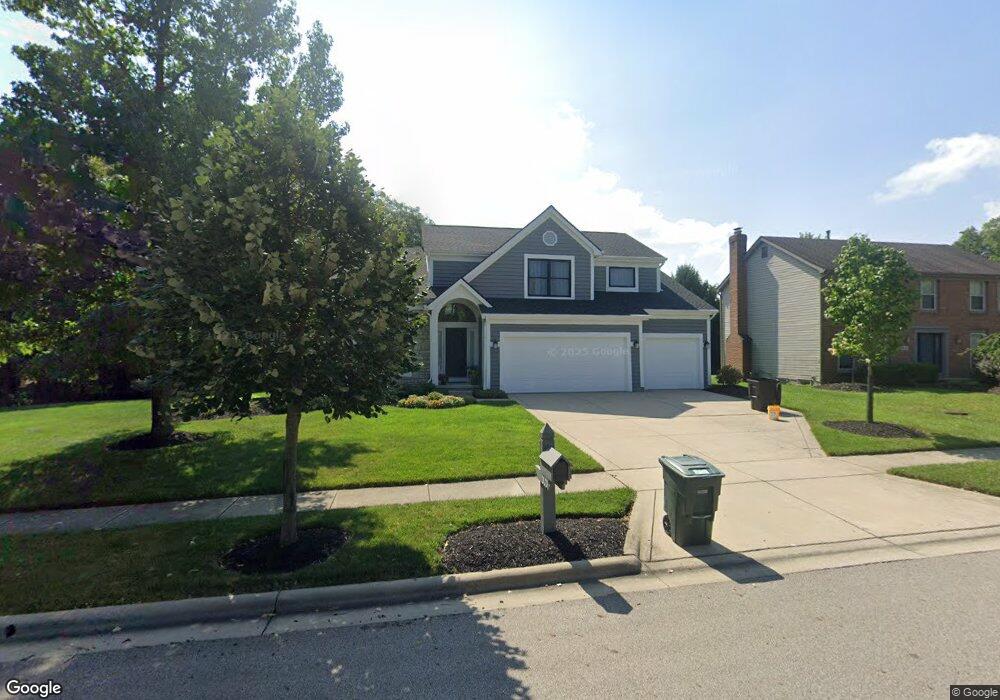
5031 Longbenton Way Dublin, OH 43017
Estimated Value: $629,014 - $782,000
4
Beds
3
Baths
2,844
Sq Ft
$241/Sq Ft
Est. Value
About This Home
This home is located at 5031 Longbenton Way, Dublin, OH 43017 and is currently estimated at $684,004, approximately $240 per square foot. 5031 Longbenton Way is a home located in Franklin County with nearby schools including Mary Emma Bailey Elementary School, John Sells Middle School, and Dublin Coffman High School.
Ownership History
Date
Name
Owned For
Owner Type
Purchase Details
Closed on
Aug 29, 2017
Sold by
Counter Richard S and Counter Mcrecedes B
Bought by
Counter Richard Scott and Counter Mercedes B
Current Estimated Value
Purchase Details
Closed on
Apr 29, 2011
Sold by
Rogers Darren Todd
Bought by
Counter Richard S and Counter Mercedes B
Home Financials for this Owner
Home Financials are based on the most recent Mortgage that was taken out on this home.
Original Mortgage
$248,000
Outstanding Balance
$7,650
Interest Rate
4.77%
Mortgage Type
Purchase Money Mortgage
Estimated Equity
$676,354
Purchase Details
Closed on
Mar 28, 2007
Sold by
Clark Jerry R
Bought by
Rogers Darren Todd
Home Financials for this Owner
Home Financials are based on the most recent Mortgage that was taken out on this home.
Original Mortgage
$288,900
Interest Rate
6.31%
Mortgage Type
Purchase Money Mortgage
Purchase Details
Closed on
Jul 1, 1993
Bought by
Clark Jerry R
Create a Home Valuation Report for This Property
The Home Valuation Report is an in-depth analysis detailing your home's value as well as a comparison with similar homes in the area
Home Values in the Area
Average Home Value in this Area
Purchase History
| Date | Buyer | Sale Price | Title Company |
|---|---|---|---|
| Counter Richard Scott | -- | Independent Title Svcs Inc | |
| Counter Richard S | -- | Independent Title Svcs Inc | |
| Counter Richard S | $311,000 | Talon Group | |
| Rogers Darren Todd | $321,000 | Talon Group | |
| Clark Jerry R | $195,400 | -- |
Source: Public Records
Mortgage History
| Date | Status | Borrower | Loan Amount |
|---|---|---|---|
| Open | Counter Richard S | $248,000 | |
| Previous Owner | Rogers Darren Todd | $288,900 |
Source: Public Records
Tax History
| Year | Tax Paid | Tax Assessment Tax Assessment Total Assessment is a certain percentage of the fair market value that is determined by local assessors to be the total taxable value of land and additions on the property. | Land | Improvement |
|---|---|---|---|---|
| 2025 | $11,625 | $178,930 | $55,550 | $123,380 |
| 2024 | $11,625 | $178,930 | $55,550 | $123,380 |
| 2023 | $11,464 | $178,920 | $55,545 | $123,375 |
| 2022 | $10,051 | $143,400 | $41,620 | $101,780 |
| 2021 | $10,076 | $143,400 | $41,620 | $101,780 |
| 2020 | $10,159 | $143,400 | $41,620 | $101,780 |
| 2019 | $10,051 | $125,480 | $36,190 | $89,290 |
| 2018 | $9,203 | $125,480 | $36,190 | $89,290 |
| 2017 | $8,807 | $125,480 | $36,190 | $89,290 |
| 2016 | $8,259 | $104,030 | $25,940 | $78,090 |
| 2015 | $8,313 | $104,030 | $25,940 | $78,090 |
| 2014 | $8,323 | $104,030 | $25,940 | $78,090 |
| 2013 | $4,034 | $99,085 | $24,710 | $74,375 |
Source: Public Records
Map
Nearby Homes
- 4931 Drymen Ct
- 5081 Broxburn Ct
- 4935 Dunkerrin Ct
- 5410 Haverhill Dr
- 4650 Chatham Ct
- 7567 Tenbury Dr
- 7985 Riverside Dr
- 7685 Haverhill Ct
- 5314 Hawthornden Ct
- 5137 Chaffinch Ct
- 5547 Villas Dr Unit 4D
- 7575 Riverside Dr
- 5119 Reserve Dr
- 8458 Invergordon Ct
- 5000 Deer Run Dr
- 7171 Blessington Ct
- 8589 Crail Ct
- 7886 Nassau Loop
- 5309 Adventure Dr
- 5317 Adventure Dr
- 4997 Longbenton Way
- 5041 Longbenton Way
- 4949 Longbenton Way
- 5014 Closeburn Ct
- 4973 Longbenton Way
- 5049 Longbenton Way
- 4945 Kilmurry Ct
- 5006 Longbenton Way
- 4947 Kilmurry Ct
- 4998 Longbenton Way
- 4943 Kilmurry Ct
- 7802 Windwood Dr
- 5022 Closeburn Ct
- 4990 Longbenton Way
- 7790 Windwood Dr
- 5038 Closeburn Ct
- 7820 Windwood Dr
- 7780 Windwood Dr
- 4958 Longbenton Way
- 4950 Longbenton Way
Your Personal Tour Guide
Ask me questions while you tour the home.