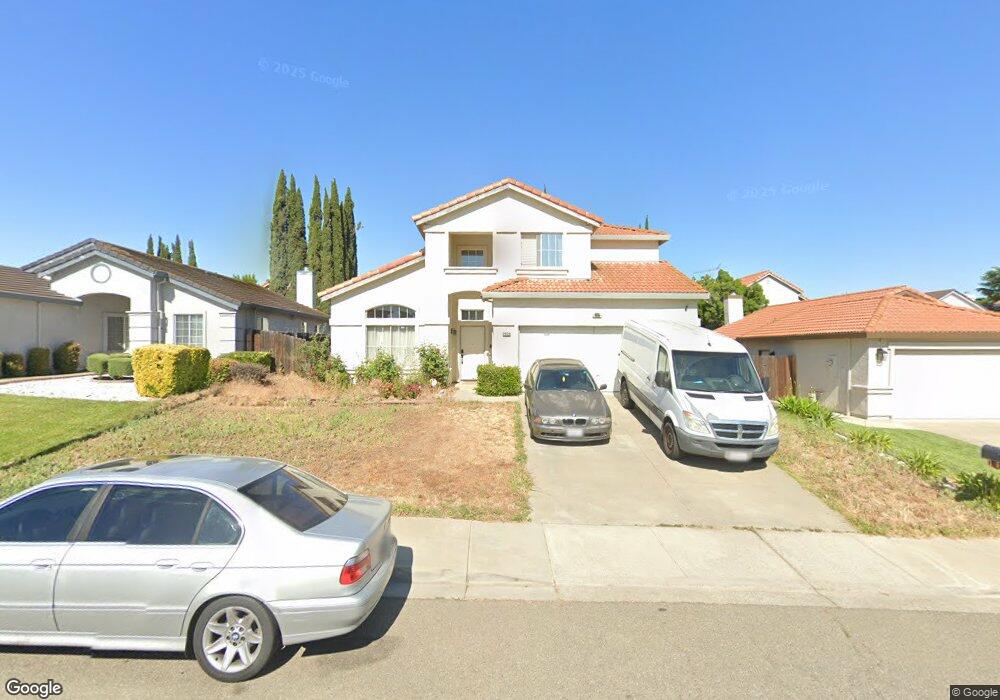
5034 Comanche Way Antioch, CA 94531
Lone Tree Valley NeighborhoodEstimated Value: $611,000 - $631,000
4
Beds
3
Baths
1,819
Sq Ft
$342/Sq Ft
Est. Value
About This Home
This home is located at 5034 Comanche Way, Antioch, CA 94531 and is currently estimated at $621,428, approximately $341 per square foot. 5034 Comanche Way is a home located in Contra Costa County with nearby schools including Diablo Vista Elementary School, Dallas Ranch Middle School, and Deer Valley High School.
Ownership History
Date
Name
Owned For
Owner Type
Purchase Details
Closed on
Oct 4, 2021
Sold by
Brown Wendy Aku and Brown Adukwei
Bought by
Brown Adukwei and Yeboah Wendy Aku
Current Estimated Value
Purchase Details
Closed on
Feb 15, 2002
Sold by
Lind Robert L
Bought by
Brown Nil Saka
Home Financials for this Owner
Home Financials are based on the most recent Mortgage that was taken out on this home.
Original Mortgage
$230,000
Outstanding Balance
$97,182
Interest Rate
7.37%
Mortgage Type
Purchase Money Mortgage
Estimated Equity
$524,246
Purchase Details
Closed on
Oct 15, 2001
Sold by
Lind Robert L
Bought by
Lind Robert L
Purchase Details
Closed on
May 13, 1997
Sold by
Antioch Valley Associates
Bought by
Lind Robert L and Lind Georgia A
Home Financials for this Owner
Home Financials are based on the most recent Mortgage that was taken out on this home.
Original Mortgage
$134,900
Interest Rate
8.13%
Mortgage Type
Purchase Money Mortgage
Create a Home Valuation Report for This Property
The Home Valuation Report is an in-depth analysis detailing your home's value as well as a comparison with similar homes in the area
Home Values in the Area
Average Home Value in this Area
Purchase History
| Date | Buyer | Sale Price | Title Company |
|---|---|---|---|
| Brown Adukwei | -- | None Available | |
| Brown Nil Saka | $287,500 | First American Title Guarant | |
| Lind Robert L | -- | -- | |
| Lind Robert L | $169,000 | Chicago Title Co |
Source: Public Records
Mortgage History
| Date | Status | Borrower | Loan Amount |
|---|---|---|---|
| Open | Brown Nil Saka | $230,000 | |
| Previous Owner | Lind Robert L | $134,900 |
Source: Public Records
Tax History Compared to Growth
Tax History
| Year | Tax Paid | Tax Assessment Tax Assessment Total Assessment is a certain percentage of the fair market value that is determined by local assessors to be the total taxable value of land and additions on the property. | Land | Improvement |
|---|---|---|---|---|
| 2025 | $5,133 | $435,483 | $155,103 | $280,380 |
| 2024 | $4,950 | $426,945 | $152,062 | $274,883 |
| 2023 | $4,950 | $418,575 | $149,081 | $269,494 |
| 2022 | $4,875 | $410,368 | $146,158 | $264,210 |
| 2021 | $4,730 | $402,323 | $143,293 | $259,030 |
| 2019 | $4,552 | $390,392 | $139,044 | $251,348 |
| 2018 | $4,381 | $382,738 | $136,318 | $246,420 |
| 2017 | $4,290 | $375,235 | $133,646 | $241,589 |
| 2016 | $4,003 | $350,000 | $124,658 | $225,342 |
| 2015 | $3,912 | $315,000 | $112,192 | $202,808 |
| 2014 | $4,186 | $279,500 | $99,548 | $179,952 |
Source: Public Records
Map
Nearby Homes
- 5000 Morgan Way
- 5021 Wagon Wheel Way
- 5052 Perry Way
- 5041 Wagon Wheel Way
- 5200 Mohican Way
- 5233 Mohican Way
- 5131 Prewett Ranch Dr
- 5165 Hereford Way
- 5115 Equestrian Ct
- 5445 Oneida Way
- 5132 Pioneer Way
- 5161 Maniago Way
- 5300 Vivaro Way
- 5428 Golden Eagle St
- 5424 Golden Eagle St
- 5420 Golden Eagle St
- 5436 Raven Way
- 5416 Golden Eagle St
- 5213 Walker Ct
- 5405 Kestrel Ct
- 5038 Comanche Way
- 5030 Comanche Way
- 5037 Toyon Way
- 5033 Toyon Way
- 5042 Comanche Way
- 5026 Comanche Way
- 5041 Toyon Way
- 5029 Toyon Way
- 5045 Toyon Way
- 5046 Comanche Way
- 5035 Comanche Way
- 5022 Comanche Way
- 5039 Comanche Way
- 5031 Comanche Way
- 5025 Toyon Way
- 5043 Comanche Way
- 5049 Toyon Way
- 5050 Comanche Way
- 5047 Comanche Way
- 5018 Comanche Way