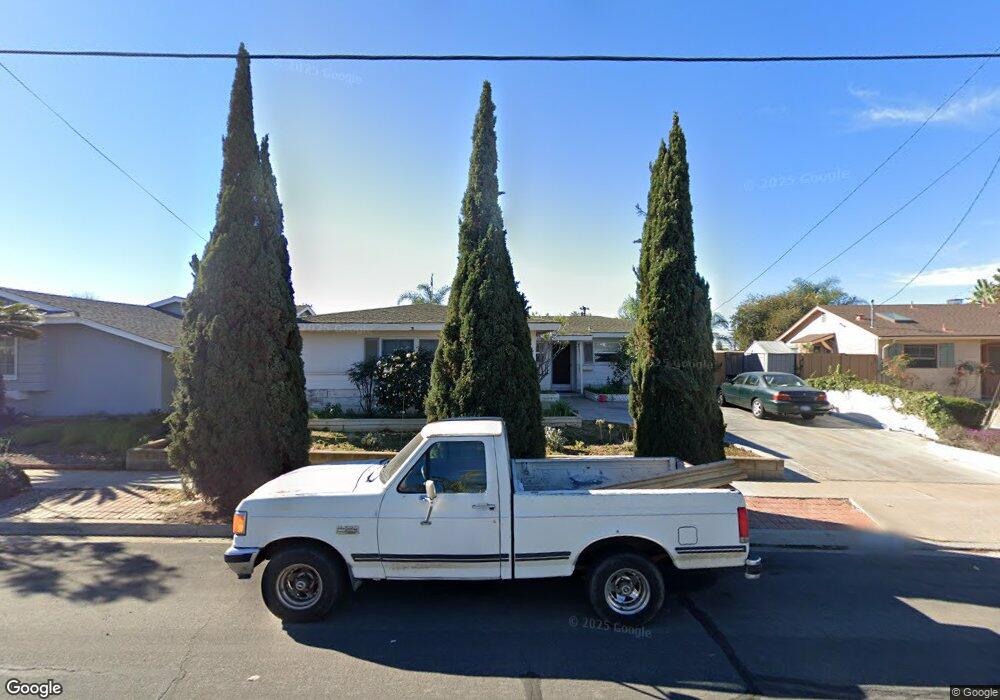
5035 Mount Frissell Dr San Diego, CA 92117
Clairemont Mesa West NeighborhoodEstimated Value: $976,000 - $1,070,000
3
Beds
2
Baths
1,188
Sq Ft
$851/Sq Ft
Est. Value
About This Home
This home is located at 5035 Mount Frissell Dr, San Diego, CA 92117 and is currently estimated at $1,011,127, approximately $851 per square foot. 5035 Mount Frissell Dr is a home located in San Diego County with nearby schools including Holmes Elementary, Marston Middle School, and Clairemont High School.
Ownership History
Date
Name
Owned For
Owner Type
Purchase Details
Closed on
Apr 29, 2005
Sold by
Jimenez Javier
Bought by
Jimenez Javier
Current Estimated Value
Home Financials for this Owner
Home Financials are based on the most recent Mortgage that was taken out on this home.
Original Mortgage
$399,000
Outstanding Balance
$210,042
Interest Rate
5.99%
Mortgage Type
New Conventional
Estimated Equity
$801,085
Purchase Details
Closed on
Aug 25, 2000
Sold by
Angela Jimenez
Bought by
Jimenez Javier
Purchase Details
Closed on
Jun 28, 1995
Sold by
Ness Hugh William
Bought by
Jimenez Javier and Jimenez Angela M
Home Financials for this Owner
Home Financials are based on the most recent Mortgage that was taken out on this home.
Original Mortgage
$144,000
Interest Rate
7.74%
Mortgage Type
Seller Take Back
Create a Home Valuation Report for This Property
The Home Valuation Report is an in-depth analysis detailing your home's value as well as a comparison with similar homes in the area
Home Values in the Area
Average Home Value in this Area
Purchase History
| Date | Buyer | Sale Price | Title Company |
|---|---|---|---|
| Jimenez Javier | -- | Southland Title Of San Diego | |
| Jimenez Javier | -- | -- | |
| Jimenez Javier | $164,000 | First American Title Co |
Source: Public Records
Mortgage History
| Date | Status | Borrower | Loan Amount |
|---|---|---|---|
| Open | Jimenez Javier | $399,000 | |
| Closed | Jimenez Javier | $144,000 |
Source: Public Records
Tax History Compared to Growth
Tax History
| Year | Tax Paid | Tax Assessment Tax Assessment Total Assessment is a certain percentage of the fair market value that is determined by local assessors to be the total taxable value of land and additions on the property. | Land | Improvement |
|---|---|---|---|---|
| 2025 | $3,229 | $272,418 | $146,686 | $125,732 |
| 2024 | $3,229 | $267,077 | $143,810 | $123,267 |
| 2023 | $3,156 | $261,841 | $140,991 | $120,850 |
| 2022 | $3,070 | $256,708 | $138,227 | $118,481 |
| 2021 | $3,048 | $251,675 | $135,517 | $116,158 |
| 2020 | $3,010 | $249,095 | $134,128 | $114,967 |
| 2019 | $2,955 | $244,212 | $131,499 | $112,713 |
| 2018 | $2,762 | $239,424 | $128,921 | $110,503 |
| 2017 | $2,695 | $234,731 | $126,394 | $108,337 |
| 2016 | $2,650 | $230,129 | $123,916 | $106,213 |
| 2015 | $2,610 | $226,673 | $122,055 | $104,618 |
| 2014 | $2,568 | $222,234 | $119,665 | $102,569 |
Source: Public Records
Map
Nearby Homes
- 4915 Mount Gaywas Dr
- 4772 Mount Gaywas Dr
- 5377 Balboa Ave
- 5252 Balboa Arms Dr Unit 180
- 5252 Balboa Arms Dr Unit 171
- 5061 Canosa Ave
- 5230 Mount Alifan Dr
- 5222 Mount Alifan Dr
- 4667 Chateau Place
- 4110 Genesee Ave
- 4108 Genesee Ave
- 5402 Balboa Arms Dr Unit 345
- 5404 Balboa Arms Dr Unit 461
- 5289 Mount Alifan Dr
- 5113 Bellvale Ave
- 5273 Mount Alifan Dr
- 4472 Mount Lindsey Ave
- 4119 Mount Alifan Place
- 4182 Mount Alifan Place Unit G
- 5252 Mount Blanca Dr
- 5045 Mount Frissell Dr
- 5023 Mount Frissell Dr
- 5032 Mount Etna Dr
- 5022 Mount Etna Dr
- 5042 Mount Etna Dr
- 5011 Mount Frissell Dr
- 5012 Mount Etna Dr
- 5052 Mount Etna Dr
- 5036 Mount Frissell Dr Unit 1
- 5024 Mount Frissell Dr
- 5048 Mount Frissell Dr
- 5062 Mount Etna Dr
- 5001 Mount Frissell Dr
- 5063 Mount Frissell Dr
- 5002 Mount Etna Dr
- 5012 Mount Frissell Dr
- 5060 Mount Frissell Dr
- 5072 Mount Etna Dr
- 4992 Mount Etna Dr
- 4981 Mount Frissell Dr