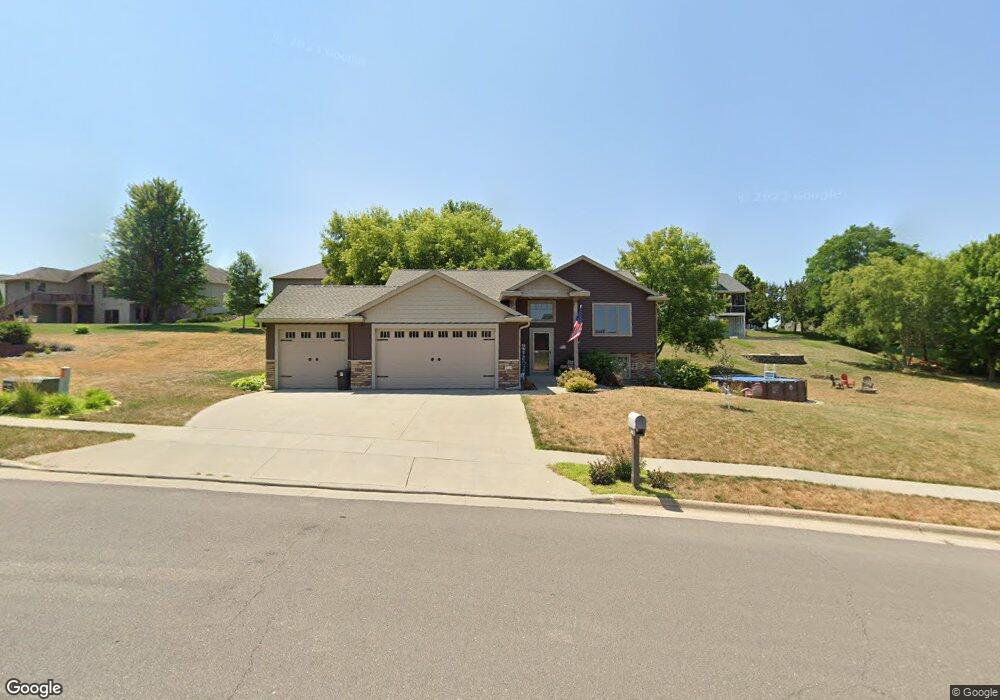
5035 Southern Place SW Rochester, MN 55902
Estimated Value: $449,607 - $490,000
4
Beds
3
Baths
2,750
Sq Ft
$171/Sq Ft
Est. Value
About This Home
This home is located at 5035 Southern Place SW, Rochester, MN 55902 and is currently estimated at $470,902, approximately $171 per square foot. 5035 Southern Place SW is a home located in Olmsted County with nearby schools including Bamber Valley Elementary School, Willow Creek Middle School, and Mayo Senior High School.
Ownership History
Date
Name
Owned For
Owner Type
Purchase Details
Closed on
Mar 21, 2016
Sold by
Inglett Chad and Inglett Sarah
Bought by
Donaldson Bryan W and Donaldson Stephanie M
Current Estimated Value
Home Financials for this Owner
Home Financials are based on the most recent Mortgage that was taken out on this home.
Original Mortgage
$276,327
Outstanding Balance
$218,712
Interest Rate
3.65%
Mortgage Type
VA
Estimated Equity
$252,190
Purchase Details
Closed on
Nov 30, 2012
Sold by
Reynolds Properties Of Rochester Llc
Bought by
Inglett Chad and Inglett Sarah
Home Financials for this Owner
Home Financials are based on the most recent Mortgage that was taken out on this home.
Original Mortgage
$233,000
Interest Rate
3.36%
Mortgage Type
Seller Take Back
Create a Home Valuation Report for This Property
The Home Valuation Report is an in-depth analysis detailing your home's value as well as a comparison with similar homes in the area
Home Values in the Area
Average Home Value in this Area
Purchase History
| Date | Buyer | Sale Price | Title Company |
|---|---|---|---|
| Donaldson Bryan W | $267,500 | Burnet Title | |
| Inglett Chad | $250,000 | Burnet Title | |
| Inglett Chad | $250,000 | None Available |
Source: Public Records
Mortgage History
| Date | Status | Borrower | Loan Amount |
|---|---|---|---|
| Open | Donaldson Bryan W | $276,327 | |
| Previous Owner | Inglett Chad | $233,000 |
Source: Public Records
Tax History Compared to Growth
Tax History
| Year | Tax Paid | Tax Assessment Tax Assessment Total Assessment is a certain percentage of the fair market value that is determined by local assessors to be the total taxable value of land and additions on the property. | Land | Improvement |
|---|---|---|---|---|
| 2024 | $5,384 | $389,900 | $50,000 | $339,900 |
| 2023 | $4,844 | $386,700 | $50,000 | $336,700 |
| 2022 | $4,268 | $364,100 | $50,000 | $314,100 |
| 2021 | $4,068 | $317,700 | $50,000 | $267,700 |
| 2020 | $4,166 | $303,700 | $50,000 | $253,700 |
| 2019 | $3,968 | $298,900 | $50,000 | $248,900 |
| 2018 | $1,911 | $287,300 | $40,000 | $247,300 |
| 2017 | $3,822 | $284,700 | $40,000 | $244,700 |
| 2016 | $3,356 | $260,000 | $38,100 | $221,900 |
| 2015 | $1,492 | $222,700 | $37,400 | $185,300 |
| 2014 | $2,964 | $210,900 | $37,100 | $173,800 |
| 2012 | -- | $40,000 | $40,000 | $0 |
Source: Public Records
Map
Nearby Homes
- 5182 Southern Ridge Ln SW
- 5274 Southwood Dr SW
- 1016 Southern Woods Place SW
- XXXX 11th Ave SW
- 5512 Leslie Ln SW
- 4887 Tee Ct SW
- 5044 Schumard Ct SE
- 278 Emory Ln SE
- 479 Pointe Ct SW
- 4788 Maine Ave SE
- 2304 Britwood Ln SW
- 2630 Scenic Point Dr SW
- 2608 Bentley Dr SW
- 3951 Willow Ct SW
- 2656 Bentley Dr SW
- 4314 Garden Ct SE
- 2657 Scenic Point Dr SW
- 2674 Scenic Point Dr SW
- 4300 Garden Ct SE
- 2621 Timber Oaks Rd SW
- 5200 Southern Ridge Ln SW
- 5043 Southern Place SW
- 5027 Southern Place SW
- 5036 Southern Place SW
- 5164 Southern Ridge Ln SW
- 5028 Southern Place SW
- 5218 Southern Ridge Ln SW
- 5146 Southern Ridge Ln SW
- 5197 Southwood Ln SW
- 5193 Southern Ridge Ln SW
- 5203 Southwood Dr SW
- 5019 Southern Place SW
- 5020 Southern Place SW
- 5157 Southwood Ln SW
- 5236 Southern Ridge Ln SW
- 5189 Southwood Ln SW
- 5165 Southern Ridge Ln SW
- 5221 Southwood Dr SW
- 5149 Southwood Ln SW
- 5245 Southern Ridge Ln SW