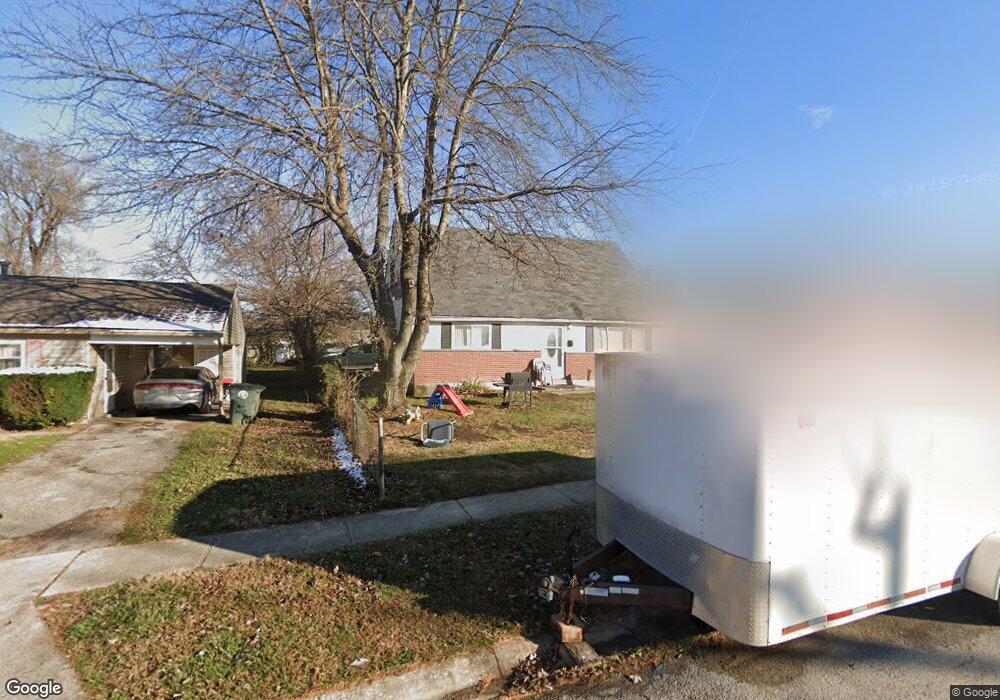
5037 Fortman Dr Dayton, OH 45417
Estimated Value: $101,000 - $124,000
3
Beds
2
Baths
1,176
Sq Ft
$96/Sq Ft
Est. Value
About This Home
This home is located at 5037 Fortman Dr, Dayton, OH 45417 and is currently estimated at $112,669, approximately $95 per square foot. 5037 Fortman Dr is a home located in Montgomery County with nearby schools including Blairwood Elementary School and Jefferson High School.
Ownership History
Date
Name
Owned For
Owner Type
Purchase Details
Closed on
May 10, 2018
Sold by
Harbour High Yield Fund Llc
Bought by
Wm Capital Partners 68 Llc
Current Estimated Value
Purchase Details
Closed on
Jun 18, 2013
Sold by
Secretary Of Hud
Bought by
Harbour High Yield Fund Llc
Purchase Details
Closed on
Mar 11, 2013
Sold by
Citimortgage Inc
Bought by
The Secretary Of Hud
Purchase Details
Closed on
Feb 15, 2013
Sold by
Stephens Anthony
Bought by
Citimortgage Inc
Purchase Details
Closed on
Jan 17, 2013
Sold by
Stephens Anthony and Chance Karen
Bought by
Citimortgage Inc
Purchase Details
Closed on
Feb 16, 2001
Sold by
Lee Selena M
Bought by
Stephens Anthony and Chance Karen
Home Financials for this Owner
Home Financials are based on the most recent Mortgage that was taken out on this home.
Original Mortgage
$59,051
Interest Rate
7.18%
Mortgage Type
FHA
Create a Home Valuation Report for This Property
The Home Valuation Report is an in-depth analysis detailing your home's value as well as a comparison with similar homes in the area
Home Values in the Area
Average Home Value in this Area
Purchase History
| Date | Buyer | Sale Price | Title Company |
|---|---|---|---|
| Wm Capital Partners 68 Llc | $20,700 | None Available | |
| Harbour High Yield Fund Llc | $13,860 | Lakeside Title | |
| The Secretary Of Hud | -- | None Available | |
| Citimortgage Inc | $64,325 | None Available | |
| Citimortgage Inc | $64,400 | None Available | |
| Stephens Anthony | $60,000 | -- |
Source: Public Records
Mortgage History
| Date | Status | Borrower | Loan Amount |
|---|---|---|---|
| Previous Owner | Stephens Anthony | $59,051 |
Source: Public Records
Tax History Compared to Growth
Tax History
| Year | Tax Paid | Tax Assessment Tax Assessment Total Assessment is a certain percentage of the fair market value that is determined by local assessors to be the total taxable value of land and additions on the property. | Land | Improvement |
|---|---|---|---|---|
| 2024 | $1,828 | $22,320 | $6,460 | $15,860 |
| 2023 | $1,828 | $22,320 | $6,460 | $15,860 |
| 2022 | $1,616 | $15,720 | $4,550 | $11,170 |
| 2021 | $1,599 | $15,720 | $4,550 | $11,170 |
| 2020 | $1,593 | $15,720 | $4,550 | $11,170 |
| 2019 | $1,376 | $12,250 | $3,150 | $9,100 |
| 2018 | $997 | $12,250 | $3,150 | $9,100 |
| 2017 | $990 | $12,250 | $3,150 | $9,100 |
| 2016 | $1,034 | $12,980 | $3,500 | $9,480 |
| 2015 | $1,128 | $12,980 | $3,500 | $9,480 |
| 2014 | $1,128 | $12,980 | $3,500 | $9,480 |
| 2012 | -- | $19,230 | $3,500 | $15,730 |
Source: Public Records
Map
Nearby Homes
- 5082 Derby Rd
- 5342 Tucson Dr
- 5212 Tucson Dr
- 4718 Belcourt Dr
- 4713 Vanguard Ave
- 1007 Rossiter Dr
- 4972 Dayton Liberty Rd
- 4605 College View Dr
- 5396 Dushore Dr
- 5357 Dushore Dr
- 1415 Olt Rd
- 3820 Germantown Pike
- 2622 Soldiers Home-West Carrollton Rd
- 2488 Olt Rd
- 3916 Cone Ct
- 3942 Alvin Ave
- 762 Ernroe Dr
- 107 Trace Ct
- 6925 W Third St
- 71 Elkins Ave
- 5025 Fortman Dr
- 5049 Fortman Dr
- 5008 Derby Rd
- 5061 Fortman Dr
- 5013 Fortman Dr
- 4998 Derby Rd
- 5016 Derby Rd
- 4988 Derby Rd
- 5038 Fortman Dr
- 5050 Fortman Dr
- 5024 Derby Rd
- 5026 Fortman Dr
- 4999 Fortman Dr
- 5073 Fortman Dr
- 5062 Fortman Dr
- 5014 Fortman Dr
- 4978 Derby Rd
- 5034 Derby Rd
- 5074 Fortman Dr
- 5085 Fortman Dr