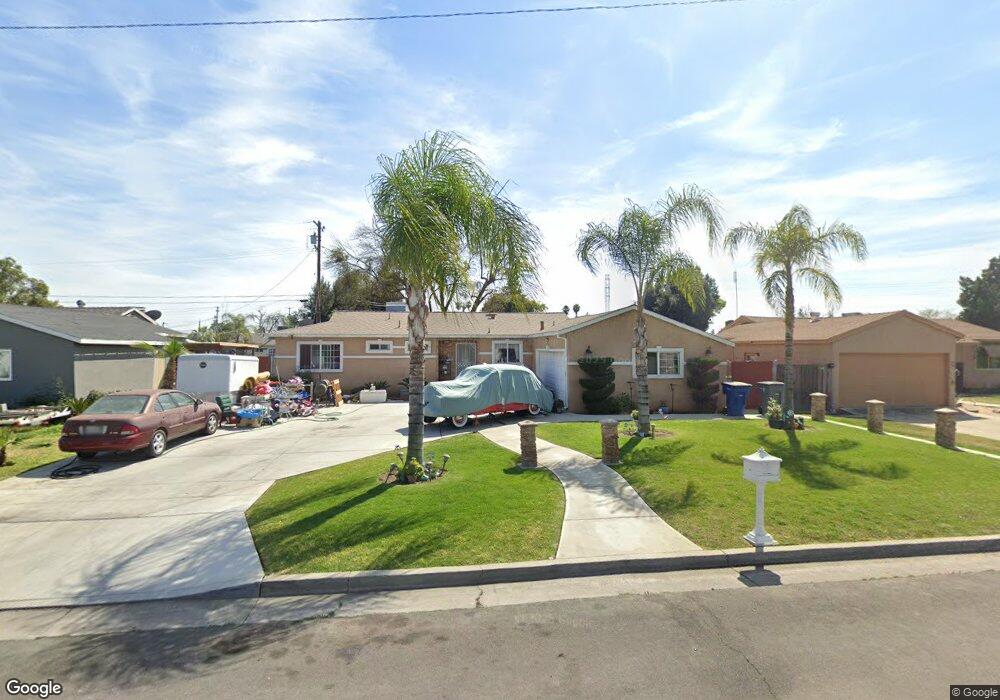
5038 E Lamona Ave Fresno, CA 93727
Roosevelt NeighborhoodEstimated Value: $304,009 - $330,000
3
Beds
2
Baths
1,246
Sq Ft
$250/Sq Ft
Est. Value
About This Home
This home is located at 5038 E Lamona Ave, Fresno, CA 93727 and is currently estimated at $312,002, approximately $250 per square foot. 5038 E Lamona Ave is a home located in Fresno County with nearby schools including Turner Elementary School, Scandinavian Middle School, and Mclane High School.
Ownership History
Date
Name
Owned For
Owner Type
Purchase Details
Closed on
Feb 28, 2018
Sold by
Nickles Rebecca
Bought by
Nickles Rebecca and 2013 Rebecca Nickles Revocable Trust
Current Estimated Value
Purchase Details
Closed on
Dec 1, 2016
Sold by
Nickles Rebecca and Sandoval Rebecca
Bought by
Nickles Rebecca
Home Financials for this Owner
Home Financials are based on the most recent Mortgage that was taken out on this home.
Original Mortgage
$118,500
Interest Rate
3.47%
Mortgage Type
New Conventional
Purchase Details
Closed on
Aug 26, 1999
Sold by
Gleckler Gerald Alan and Gleckler Sahron K
Bought by
Sandoval Rebecca
Home Financials for this Owner
Home Financials are based on the most recent Mortgage that was taken out on this home.
Original Mortgage
$57,600
Interest Rate
7.97%
Mortgage Type
Balloon
Purchase Details
Closed on
Feb 8, 1999
Sold by
Kinter Dan M and Kinter Michele M
Bought by
Washington Mutual Bank Fa and Home Svgs Of America Fsb
Create a Home Valuation Report for This Property
The Home Valuation Report is an in-depth analysis detailing your home's value as well as a comparison with similar homes in the area
Home Values in the Area
Average Home Value in this Area
Purchase History
| Date | Buyer | Sale Price | Title Company |
|---|---|---|---|
| Nickles Rebecca | -- | None Available | |
| Nickles Rebecca | -- | None Available | |
| Nickles Rebecca | -- | Fidelity National Title Co | |
| Sandoval Rebecca | $72,000 | Fidelity National Title Co | |
| Washington Mutual Bank Fa | $57,000 | Stewart Title |
Source: Public Records
Mortgage History
| Date | Status | Borrower | Loan Amount |
|---|---|---|---|
| Previous Owner | Nickles Rebecca | $118,500 | |
| Previous Owner | Sandoval Rebecca | $57,600 |
Source: Public Records
Tax History Compared to Growth
Tax History
| Year | Tax Paid | Tax Assessment Tax Assessment Total Assessment is a certain percentage of the fair market value that is determined by local assessors to be the total taxable value of land and additions on the property. | Land | Improvement |
|---|---|---|---|---|
| 2025 | $1,319 | $110,636 | $33,798 | $76,838 |
| 2023 | $1,293 | $106,342 | $32,487 | $73,855 |
| 2022 | $1,273 | $104,257 | $31,850 | $72,407 |
| 2021 | $1,237 | $102,214 | $31,226 | $70,988 |
| 2020 | $1,231 | $101,167 | $30,906 | $70,261 |
| 2019 | $1,183 | $99,184 | $30,300 | $68,884 |
| 2018 | $1,156 | $97,240 | $29,706 | $67,534 |
| 2017 | $1,135 | $95,334 | $29,124 | $66,210 |
| 2016 | $1,096 | $93,465 | $28,553 | $64,912 |
| 2015 | $1,079 | $92,062 | $28,125 | $63,937 |
| 2014 | $1,055 | $90,260 | $27,575 | $62,685 |
Source: Public Records
Map
Nearby Homes
- 5053 E Lamona Ave
- 1353 N Adler Ave
- 1431 N Willow Ave
- 6523 E Sooner Dr
- 5009 E Clay Ave
- 5060 E Weathermaker Ave
- 4942 E Oslin Ave
- 5026 E Lewis Ave
- 5181 E Olive Ave Unit 117
- 4904 E Weathermaker Ave
- 1221 N Peach Ave Unit 226
- 4875 E Mckinley Ave Unit 129
- 4808 E Pine Ave
- 1745 N Winery Ave Unit multi
- 1745 N Winery Ave Unit 102
- 4819 E Home Ave
- Residence 1651 Plan at The Avenue
- Residence 1402 Plan at The Avenue
- Residence 1227 Plan at The Avenue
- 1336 N Homsy Ave
- 5042 E Lamona Ave
- 5030 E Lamona Ave
- 1318 N Adler Ave
- 5041 E Hedges Ave
- 5048 E Lamona Ave
- 5035 E Hedges Ave
- 5047 E Hedges Ave
- 5039 E Lamona Ave
- 1306 N Adler Ave
- 5043 E Lamona Ave
- 5033 E Lamona Ave
- 5054 E Lamona Ave
- 5049 E Lamona Ave
- 5055 E Hedges Ave
- 1329 N Adler Ave
- 1341 N Adler Ave
- 1317 N Adler Ave
- 5029 E Hedges Ave
- 5060 E Lamona Ave
- 1364 N Adler Ave