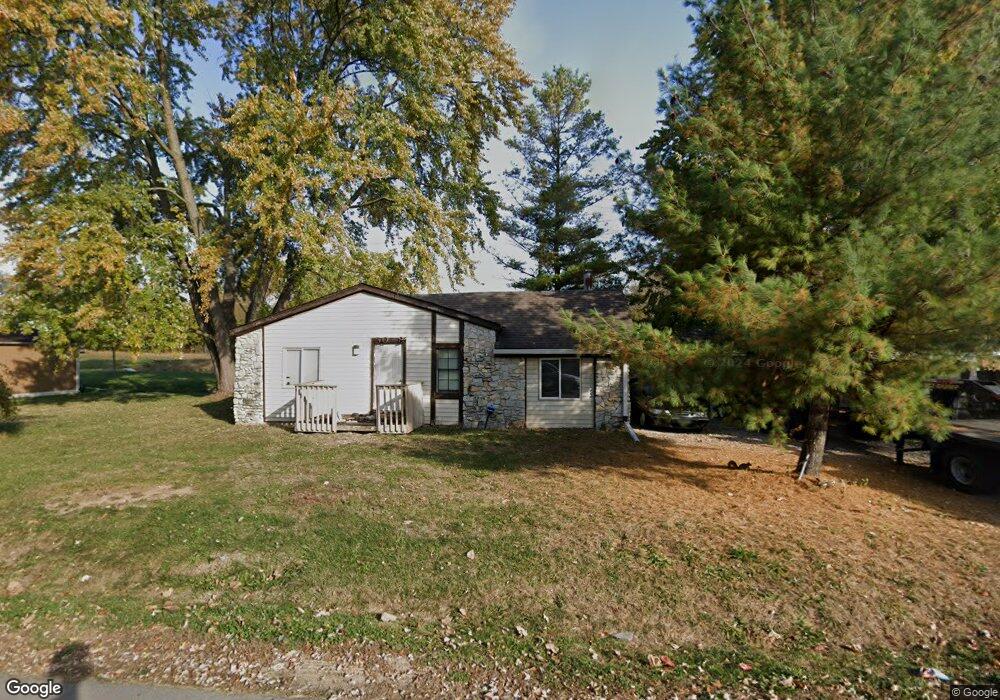
5038 W Legrande Ave Indianapolis, IN 46241
Stout Field NeighborhoodEstimated Value: $149,000 - $183,000
1
Bed
1
Bath
868
Sq Ft
$186/Sq Ft
Est. Value
About This Home
This home is located at 5038 W Legrande Ave, Indianapolis, IN 46241 and is currently estimated at $161,824, approximately $186 per square foot. 5038 W Legrande Ave is a home located in Marion County with nearby schools including Maplewood Elementary School, Lynhurst 7th & 8th Grade Center, and Ben Davis University High School.
Ownership History
Date
Name
Owned For
Owner Type
Purchase Details
Closed on
Jun 12, 2015
Sold by
Marion County Board Of Commissioners
Bought by
Molina Laura
Current Estimated Value
Purchase Details
Closed on
Jun 11, 2015
Sold by
Root Ladonna and Root Andrew Thomas
Bought by
Marion County
Purchase Details
Closed on
Sep 10, 2007
Sold by
Dlj Mortgage Capital Inc
Bought by
Root Ladonna and Root Andrew Thomas
Purchase Details
Closed on
Nov 1, 2006
Sold by
Holman Benjamin S and Doe John
Bought by
Dlj Mortgage Capital Inc
Purchase Details
Closed on
Apr 27, 2005
Sold by
Moore Timothy Parker
Bought by
Holman Benjamin S
Home Financials for this Owner
Home Financials are based on the most recent Mortgage that was taken out on this home.
Original Mortgage
$52,700
Interest Rate
6.06%
Mortgage Type
New Conventional
Create a Home Valuation Report for This Property
The Home Valuation Report is an in-depth analysis detailing your home's value as well as a comparison with similar homes in the area
Home Values in the Area
Average Home Value in this Area
Purchase History
| Date | Buyer | Sale Price | Title Company |
|---|---|---|---|
| Molina Laura | $2,800 | None Available | |
| Marion County | $4,213 | None Available | |
| Root Ladonna | $17,500 | First American Title Ins Co | |
| Dlj Mortgage Capital Inc | $54,675 | None Available | |
| Holman Benjamin S | -- | None Available |
Source: Public Records
Mortgage History
| Date | Status | Borrower | Loan Amount |
|---|---|---|---|
| Previous Owner | Holman Benjamin S | $52,700 |
Source: Public Records
Tax History Compared to Growth
Tax History
| Year | Tax Paid | Tax Assessment Tax Assessment Total Assessment is a certain percentage of the fair market value that is determined by local assessors to be the total taxable value of land and additions on the property. | Land | Improvement |
|---|---|---|---|---|
| 2024 | $2,907 | $118,200 | $21,300 | $96,900 |
| 2023 | $2,907 | $119,200 | $21,300 | $97,900 |
| 2022 | $2,701 | $110,500 | $21,300 | $89,200 |
| 2021 | $1,529 | $52,600 | $21,300 | $31,300 |
| 2020 | $1,488 | $51,200 | $21,300 | $29,900 |
| 2019 | $1,485 | $51,200 | $21,300 | $29,900 |
| 2018 | $1,391 | $54,900 | $21,300 | $33,600 |
| 2017 | $1,386 | $54,800 | $21,300 | $33,500 |
| 2016 | $1,516 | $60,400 | $21,300 | $39,100 |
| 2014 | $790 | $39,500 | $5,300 | $34,200 |
| 2013 | $768 | $39,500 | $5,300 | $34,200 |
Source: Public Records
Map
Nearby Homes
- 5018 W Legrande Ave
- 5022 W Legrande Ave
- 5030 W Legrande Ave
- 5026 W Legrande Ave
- 4835 W Regent St
- 4825 Melrose Ave
- 4839 W Regent St
- 4622 W Caven St
- 4731 Mecca St
- 4725 Mecca St
- 1622 Beulah Ave
- 4625 Melrose Ave
- 4625 W Naomi St
- 4607 Melrose Ave
- 1329 Phillips Dr
- 1304 Phillips Dr
- 2601 S Cole St
- 2605 Woodrow Ave
- 1414 Ingomar St
- 5510 Chelsea Rd
- 5050 W Legrande Ave
- 4738+ W Legrande Ave
- 4902 W Legrande Ave
- 4738 W Legrande Ave
- 5037 W Legrande Ave
- 5041 W Legrande Ave
- 1951 Beulah Ave
- 5049 W Legrande Ave
- 5029 W Beecher St
- 5020 W Legrande Ave
- 5049 W Beecher St
- 5061 W Legrande Ave
- 5102 W Legrande Ave
- 5037 W Beecher St
- 5017 W Legrande Ave
- 5021 W Beecher St
- 5050 Mecca St
- 5017 W Beecher St
- 5058 Mecca St