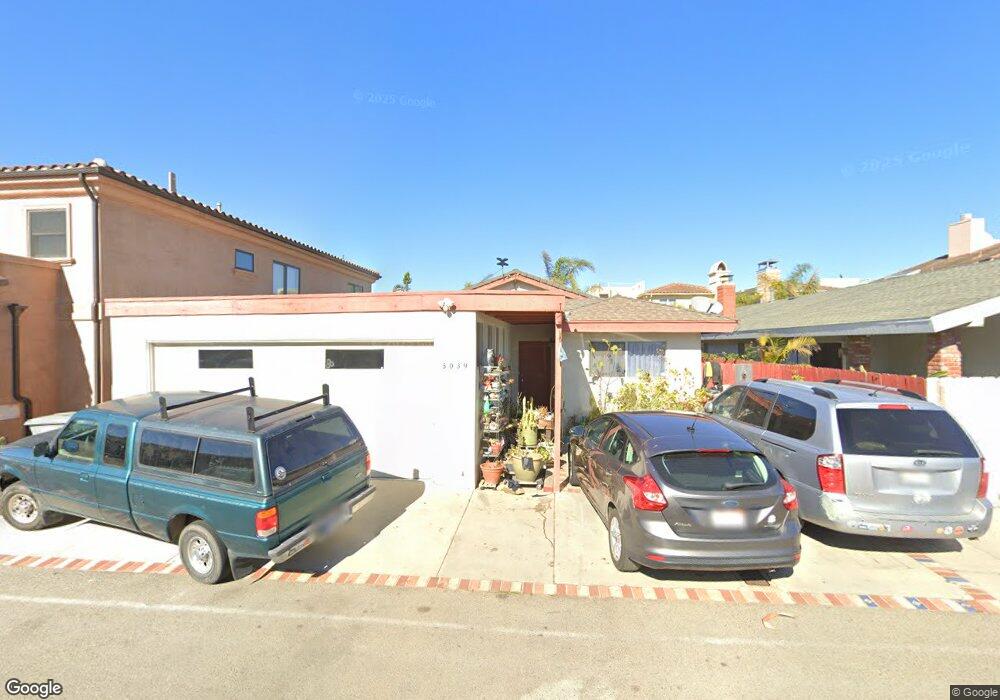
5039 Sealane Way Oxnard, CA 93035
Oxnard Shores NeighborhoodEstimated Value: $1,228,732 - $1,517,000
3
Beds
2
Baths
1,555
Sq Ft
$861/Sq Ft
Est. Value
About This Home
This home is located at 5039 Sealane Way, Oxnard, CA 93035 and is currently estimated at $1,339,433, approximately $861 per square foot. 5039 Sealane Way is a home located in Ventura County with nearby schools including Christa Mcauliffe Elementary School and Oxnard High School.
Ownership History
Date
Name
Owned For
Owner Type
Purchase Details
Closed on
Jul 21, 2025
Sold by
Shore Mark K and Shore Diane A
Bought by
Mark And Diane Shore Family Trust and Shore
Current Estimated Value
Purchase Details
Closed on
Oct 13, 2010
Sold by
Shore Mark K and Shore Diane A
Bought by
Shore Mark K and Shore Diane A
Home Financials for this Owner
Home Financials are based on the most recent Mortgage that was taken out on this home.
Original Mortgage
$155,000
Interest Rate
3.77%
Mortgage Type
New Conventional
Purchase Details
Closed on
Oct 26, 1998
Sold by
Curtis Mitchell Julie Ann
Bought by
Mitchell Brian L
Home Financials for this Owner
Home Financials are based on the most recent Mortgage that was taken out on this home.
Original Mortgage
$183,500
Interest Rate
6.6%
Purchase Details
Closed on
Sep 24, 1998
Sold by
Mitchell Allen L and Mitchell Brian L
Bought by
Shore Mark K and Rothstein Diane
Home Financials for this Owner
Home Financials are based on the most recent Mortgage that was taken out on this home.
Original Mortgage
$183,500
Interest Rate
6.6%
Purchase Details
Closed on
Nov 22, 1995
Sold by
Mitchell Kevin S
Bought by
Mitchell Allen R and Mitchell Brian L
Purchase Details
Closed on
Nov 17, 1995
Sold by
Macdonald Miranda J
Bought by
Mitchell Allen R and Mitchell Brian L
Create a Home Valuation Report for This Property
The Home Valuation Report is an in-depth analysis detailing your home's value as well as a comparison with similar homes in the area
Home Values in the Area
Average Home Value in this Area
Purchase History
| Date | Buyer | Sale Price | Title Company |
|---|---|---|---|
| Mark And Diane Shore Family Trust | -- | None Listed On Document | |
| Shore Mark K | -- | Equity Title Los Angeles | |
| Mitchell Brian L | -- | Chicago Title Co | |
| Mitchell Allen R | -- | Chicago Title Co | |
| Shore Mark K | $243,000 | Chicago Title | |
| Mitchell Allen R | $123,000 | Chicago Title Co | |
| Mitchell Allen R | -- | Chicago Title Co |
Source: Public Records
Mortgage History
| Date | Status | Borrower | Loan Amount |
|---|---|---|---|
| Previous Owner | Shore Mark K | $155,000 | |
| Previous Owner | Shore Mark K | $183,500 |
Source: Public Records
Tax History Compared to Growth
Tax History
| Year | Tax Paid | Tax Assessment Tax Assessment Total Assessment is a certain percentage of the fair market value that is determined by local assessors to be the total taxable value of land and additions on the property. | Land | Improvement |
|---|---|---|---|---|
| 2025 | $4,544 | $380,925 | $266,500 | $114,425 |
| 2024 | $4,544 | $373,456 | $261,274 | $112,182 |
| 2023 | $4,377 | $366,134 | $256,151 | $109,983 |
| 2022 | $4,244 | $358,955 | $251,128 | $107,827 |
| 2021 | $4,208 | $351,917 | $246,204 | $105,713 |
| 2020 | $4,285 | $348,311 | $243,681 | $104,630 |
| 2019 | $4,163 | $341,482 | $238,903 | $102,579 |
| 2018 | $4,103 | $334,787 | $234,219 | $100,568 |
| 2017 | $3,893 | $328,224 | $229,627 | $98,597 |
| 2016 | $3,755 | $321,789 | $225,125 | $96,664 |
| 2015 | $3,794 | $316,958 | $221,745 | $95,213 |
| 2014 | $3,750 | $310,751 | $217,402 | $93,349 |
Source: Public Records
Map
Nearby Homes
- 1230 Mandalay Beach Rd
- 5125 W Wooley Rd Unit 5
- 4940 Dunes St
- 5121 Breakwater Way
- 4906 Dunes St
- 1020 Dunes St
- 5113 Whitecap St
- 1068 Canal St
- 1235 Capri Way
- 1211 Capri Way
- 1410 Marine Way
- 5244 Whitecap St
- 1135 Capri Way
- 911 Dunes St
- 1417 Marine Way
- 920 Catamaran St
- 4941 Catamaran St
- 4911 Oceanaire St
- 5245 Seabreeze Way
- 5331 Wavecrest Way
- 5045 Sealane Way
- 5033 Sealane Way
- 5051 Sealane Way
- 5027 Sealane Way
- 5020 Terramar Way
- 5012 Terramar Way
- 5057 Sealane Way
- 5021 Sealane Way
- 5024 Terramar Way
- 5042 Sealane Way
- 5036 Sealane Way
- 5010 Terramar Way
- 5048 Sealane Way
- 5030 Sealane Way
- 5030 Terramar Way
- 5054 Sealane Way
- 5024 Sealane Way
- 5065 Sealane Way
- 5013 Sealane Way
- 5008 Terramar Way