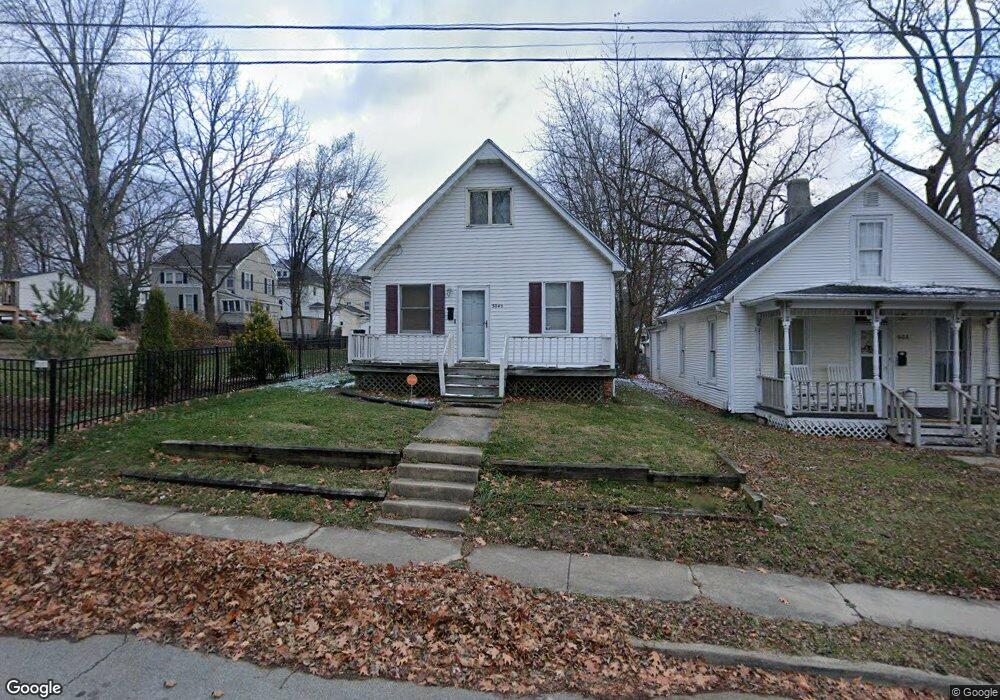
504 1/2 S Evans St Bloomington, IL 61701
Estimated Value: $144,739 - $154,000
2
Beds
2
Baths
1,296
Sq Ft
$116/Sq Ft
Est. Value
About This Home
This home is located at 504 1/2 S Evans St, Bloomington, IL 61701 and is currently estimated at $149,935, approximately $115 per square foot. 504 1/2 S Evans St is a home located in McLean County with nearby schools including Sheridan Elementary School, Bloomington Junior High School, and Bloomington High School.
Ownership History
Date
Name
Owned For
Owner Type
Purchase Details
Closed on
Mar 26, 2010
Sold by
Wilson Michael J
Bought by
Wait Amanda S
Current Estimated Value
Home Financials for this Owner
Home Financials are based on the most recent Mortgage that was taken out on this home.
Original Mortgage
$92,297
Outstanding Balance
$62,229
Interest Rate
5.25%
Mortgage Type
FHA
Estimated Equity
$87,706
Purchase Details
Closed on
Aug 5, 2009
Sold by
Heartland Bank & Trust Company
Bought by
Wilson Michael J and Mclean County Land Trust Wfiii
Purchase Details
Closed on
Jul 2, 2009
Sold by
Waller Ward D
Bought by
Heartland Bank & Trust Company
Purchase Details
Closed on
Feb 7, 2008
Sold by
Waller Tom C and Waller Nancy L
Bought by
Waller Homes Inc
Home Financials for this Owner
Home Financials are based on the most recent Mortgage that was taken out on this home.
Original Mortgage
$120,000
Interest Rate
5.51%
Create a Home Valuation Report for This Property
The Home Valuation Report is an in-depth analysis detailing your home's value as well as a comparison with similar homes in the area
Home Values in the Area
Average Home Value in this Area
Purchase History
| Date | Buyer | Sale Price | Title Company |
|---|---|---|---|
| Wait Amanda S | $94,000 | Mclean County Title | |
| Wilson Michael J | $35,000 | First Community Title | |
| Heartland Bank & Trust Company | -- | None Available | |
| Waller Homes Inc | -- | First Community Title |
Source: Public Records
Mortgage History
| Date | Status | Borrower | Loan Amount |
|---|---|---|---|
| Open | Wait Amanda S | $92,297 | |
| Previous Owner | Waller Homes Inc | $120,000 |
Source: Public Records
Tax History Compared to Growth
Tax History
| Year | Tax Paid | Tax Assessment Tax Assessment Total Assessment is a certain percentage of the fair market value that is determined by local assessors to be the total taxable value of land and additions on the property. | Land | Improvement |
|---|---|---|---|---|
| 2024 | $2,187 | $38,684 | $7,577 | $31,107 |
| 2022 | $2,187 | $31,727 | $6,214 | $25,513 |
| 2021 | $2,045 | $30,060 | $5,887 | $24,173 |
| 2020 | $2,009 | $29,703 | $5,817 | $23,886 |
| 2019 | $2,003 | $29,703 | $5,817 | $23,886 |
| 2018 | $2,500 | $29,703 | $5,817 | $23,886 |
| 2017 | $2,501 | $29,703 | $5,817 | $23,886 |
| 2016 | $2,550 | $30,340 | $5,942 | $24,398 |
| 2015 | $2,484 | $29,644 | $5,806 | $23,838 |
| 2014 | $2,292 | $28,244 | $5,806 | $22,438 |
| 2013 | -- | $27,690 | $5,692 | $21,998 |
Source: Public Records
Map
Nearby Homes
- 409 E Taylor St
- 614 S Clinton St
- 304 S Prairie St
- 807 E Wood St
- 811 E Washington St
- 816 Bunn St
- 707 S Center St
- 825 E Jefferson St
- 1205 E Oakland Ave
- 802 S Madison St
- 203 Denver St
- 712 E Monroe St
- 806 E Monroe St
- 904 S Madison St
- 410 N Mclean St
- 1105 E Grove St
- 912 S Madison St
- 402-404 W Olive St
- 1111 E Grove St
- 212 N Center St Unit 205
- 506 S Evans St
- 508 S Evans St
- 508 1/2 S Evans St
- 601 E Jackson St
- 614 E Mill St
- 607 E Jackson St
- 503 S Evans St
- 505 S Clayton St
- 510 S Evans St
- 503 S Clayton St
- 507 S Clayton St
- 507 S Clayton St
- 513 E Jackson St
- 612 E Mill St
- 512 S Evans St
- 511 E Jackson St
- 509 S Clayton St
- 501 S Clayton St
- 613 E Mill St
- 610 E Mill St