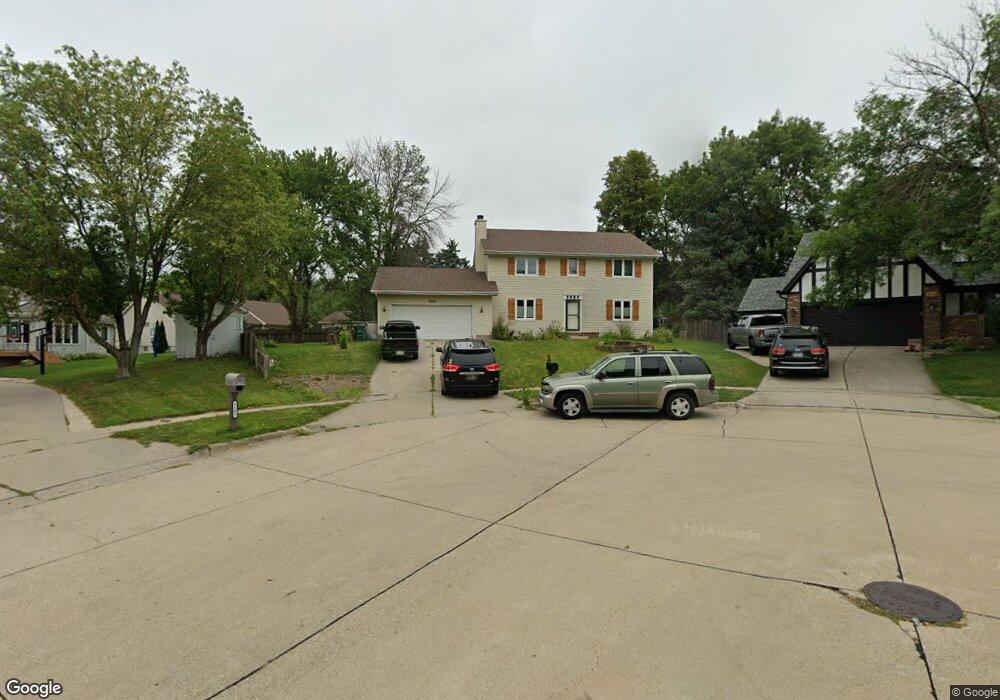
504 52nd St West Des Moines, IA 50265
Estimated Value: $341,000 - $358,000
4
Beds
3
Baths
2,136
Sq Ft
$164/Sq Ft
Est. Value
About This Home
This home is located at 504 52nd St, West Des Moines, IA 50265 and is currently estimated at $350,423, approximately $164 per square foot. 504 52nd St is a home located in Polk County with nearby schools including Crossroads Park Elementary School, Valley Southwoods Freshman High School, and Indian Hills Junior High School.
Ownership History
Date
Name
Owned For
Owner Type
Purchase Details
Closed on
Sep 25, 2003
Sold by
Smith Matthew and Smith Kristen
Bought by
Swank Randy and Swank Tammy
Current Estimated Value
Home Financials for this Owner
Home Financials are based on the most recent Mortgage that was taken out on this home.
Original Mortgage
$187,400
Outstanding Balance
$106,603
Interest Rate
9.67%
Mortgage Type
Land Contract Argmt. Of Sale
Estimated Equity
$243,820
Purchase Details
Closed on
Apr 21, 1999
Sold by
Coon Brian C and Coon Kristina A
Bought by
Braune Michael L and Braune Theresa A
Home Financials for this Owner
Home Financials are based on the most recent Mortgage that was taken out on this home.
Original Mortgage
$132,000
Interest Rate
7.17%
Purchase Details
Closed on
Nov 11, 1997
Sold by
Walter Dan P and Walter Margaret M
Bought by
Coon Brian C and Coon Kristina A
Home Financials for this Owner
Home Financials are based on the most recent Mortgage that was taken out on this home.
Original Mortgage
$142,655
Interest Rate
7.46%
Mortgage Type
VA
Create a Home Valuation Report for This Property
The Home Valuation Report is an in-depth analysis detailing your home's value as well as a comparison with similar homes in the area
Home Values in the Area
Average Home Value in this Area
Purchase History
| Date | Buyer | Sale Price | Title Company |
|---|---|---|---|
| Swank Randy | $189,900 | -- | |
| Braune Michael L | $164,500 | -- | |
| Coon Brian C | $138,000 | -- |
Source: Public Records
Mortgage History
| Date | Status | Borrower | Loan Amount |
|---|---|---|---|
| Open | Swank Randy | $187,400 | |
| Closed | Braune Michael L | $132,000 | |
| Previous Owner | Coon Brian C | $142,655 |
Source: Public Records
Tax History Compared to Growth
Tax History
| Year | Tax Paid | Tax Assessment Tax Assessment Total Assessment is a certain percentage of the fair market value that is determined by local assessors to be the total taxable value of land and additions on the property. | Land | Improvement |
|---|---|---|---|---|
| 2025 | $4,718 | $328,900 | $69,900 | $259,000 |
| 2024 | $4,718 | $308,100 | $64,700 | $243,400 |
| 2023 | $4,824 | $308,100 | $64,700 | $243,400 |
| 2022 | $4,766 | $258,700 | $55,600 | $203,100 |
| 2021 | $4,686 | $258,700 | $55,600 | $203,100 |
| 2020 | $4,612 | $242,300 | $52,000 | $190,300 |
| 2019 | $3,984 | $242,300 | $52,000 | $190,300 |
| 2018 | $3,990 | $203,000 | $46,200 | $156,800 |
| 2017 | $4,196 | $203,000 | $46,200 | $156,800 |
| 2016 | $4,100 | $207,000 | $41,200 | $165,800 |
| 2015 | $4,100 | $207,000 | $41,200 | $165,800 |
| 2014 | $3,948 | $197,500 | $38,700 | $158,800 |
Source: Public Records
Map
Nearby Homes
- 509 Knolls Rd
- 5204 Boulder Dr
- 5205 Stonebridge Rd
- 5201 Stonebridge Rd
- 5208 Boulder Dr
- 5200 Boulder Dr
- 509 52nd St
- 5100 Boulder Dr
- 505 52nd St
- 516 51st St
- 520 51st St
- 512 51st St
- 501 52nd St
- 5215 Stonebridge Place
- 5205 Boulder Dr
- 422 52nd St
- 5209 Boulder Dr
- 508 51st St
- 493 52nd Ct
- 5220 Boulder Dr Unit 8