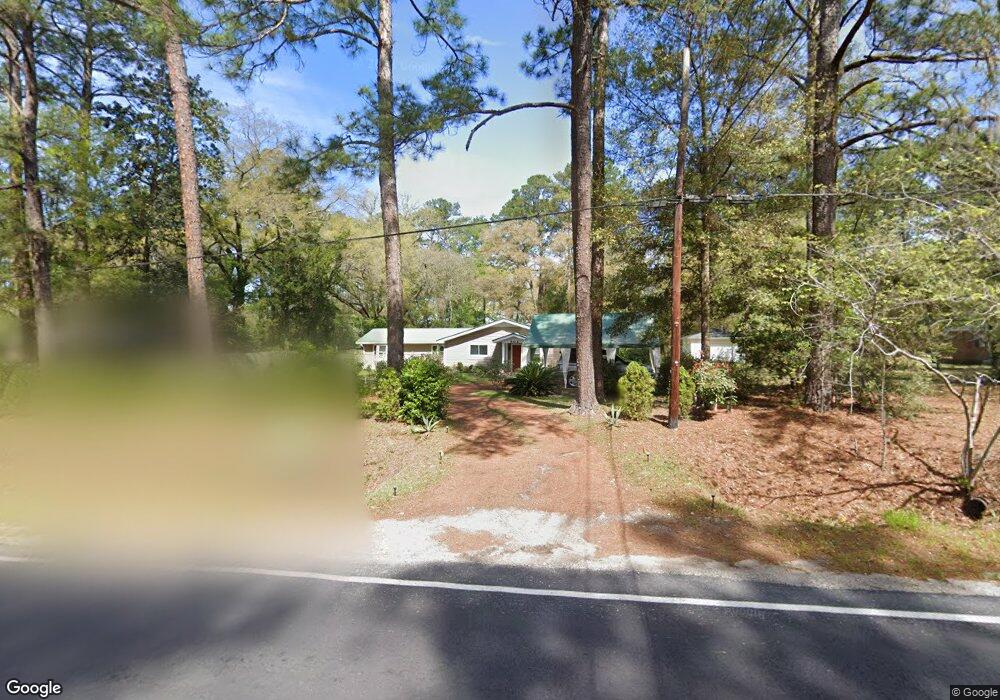
504 E 4th St Rincon, GA 31326
Estimated Value: $221,000 - $281,000
3
Beds
2
Baths
1,880
Sq Ft
$135/Sq Ft
Est. Value
About This Home
This home is located at 504 E 4th St, Rincon, GA 31326 and is currently estimated at $254,045, approximately $135 per square foot. 504 E 4th St is a home located in Effingham County with nearby schools including Rincon Elementary School, Ebenezer Middle School, and Effingham County High School.
Ownership History
Date
Name
Owned For
Owner Type
Purchase Details
Closed on
Jul 13, 2018
Sold by
Herman Holland P
Bought by
Holland Willie A
Current Estimated Value
Purchase Details
Closed on
Aug 28, 2009
Sold by
Federal National Mortgage Association
Bought by
Volynets Vadim and Volynets Marina
Home Financials for this Owner
Home Financials are based on the most recent Mortgage that was taken out on this home.
Original Mortgage
$69,000
Interest Rate
5.5%
Mortgage Type
New Conventional
Purchase Details
Closed on
Jun 2, 2009
Sold by
Nationstar Mortgage Llc
Bought by
Federal National Mortgage Association
Purchase Details
Closed on
Apr 18, 2005
Sold by
Hall Wanda M
Bought by
Hall John D and Hall Wanda M
Home Financials for this Owner
Home Financials are based on the most recent Mortgage that was taken out on this home.
Original Mortgage
$109,800
Interest Rate
5.99%
Mortgage Type
New Conventional
Create a Home Valuation Report for This Property
The Home Valuation Report is an in-depth analysis detailing your home's value as well as a comparison with similar homes in the area
Home Values in the Area
Average Home Value in this Area
Purchase History
| Date | Buyer | Sale Price | Title Company |
|---|---|---|---|
| Holland Willie A | -- | -- | |
| Volynets Vadim | -- | -- | |
| Federal National Mortgage Association | $118,526 | -- | |
| Nationstar Mortgage Llc | $118,526 | -- | |
| Hall John D | -- | -- |
Source: Public Records
Mortgage History
| Date | Status | Borrower | Loan Amount |
|---|---|---|---|
| Previous Owner | Volynets Vadim | $69,000 | |
| Previous Owner | Hall John D | $109,800 |
Source: Public Records
Tax History
| Year | Tax Paid | Tax Assessment Tax Assessment Total Assessment is a certain percentage of the fair market value that is determined by local assessors to be the total taxable value of land and additions on the property. | Land | Improvement |
|---|---|---|---|---|
| 2025 | $1,050 | $51,375 | $19,200 | $32,175 |
| 2024 | $1,050 | $57,921 | $19,200 | $38,721 |
| 2023 | $460 | $48,454 | $16,800 | $31,654 |
| 2022 | $939 | $38,478 | $15,052 | $23,426 |
| 2021 | $954 | $38,478 | $15,052 | $23,426 |
| 2020 | $1,618 | $55,590 | $14,400 | $41,190 |
| 2019 | $1,285 | $44,862 | $12,000 | $32,862 |
| 2018 | $1,328 | $47,516 | $9,600 | $37,916 |
| 2017 | $1,218 | $42,947 | $9,600 | $33,347 |
| 2016 | $1,099 | $38,383 | $10,800 | $27,583 |
| 2015 | $1,105 | $38,383 | $10,800 | $27,583 |
| 2014 | $1,046 | $35,983 | $8,400 | $27,583 |
| 2013 | -- | $35,982 | $8,400 | $27,582 |
Source: Public Records
Map
Nearby Homes
- 704 Lexington Ave
- 103 Warren St
- 801 Lexington Ave
- 119 Fox Trace
- 406 Lexington Ave
- 407 Lexington Ave
- 108 Crossing Cir
- 301 Cone St
- 121 Watson Dr
- 811 Rosalie Ct
- 107 Acorn St
- 0 E Fifth St Unit 10605519
- 0 E Fifth St Unit SA339176
- 106 Willowdell Ct
- 509 Greenbay Ave
- 136 Fraser Ln
- 407 Woodhill Ct
- 10 Michelle Ct
- 201 Bailee Ave
- 120 Four Oaks Ct
- 502 E 4th St
- 506 E 4th St
- 317 S Columbia Ave
- 106 Tyler St
- E E 4th St
- 508 E 4th St
- 503 E Williams St
- 108 Tyler St
- 217 Tyler St
- 505 E Williams St
- 215 Tyler St
- 507 E Williams St
- 510 E 4th St
- 213 Tyler St
- 509 E Williams St
- 502 E Williams St
- 504 E Williams St
- 211 Tyler St
- 506 E Williams St
- 508 E Williams St
Your Personal Tour Guide
Ask me questions while you tour the home.