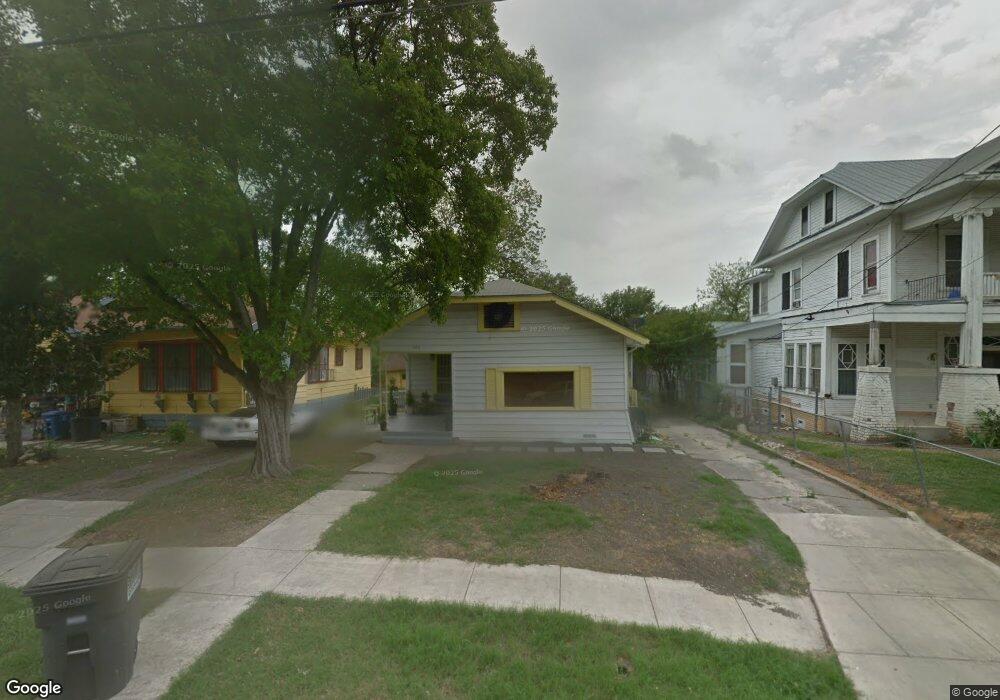
504 E Evergreen St San Antonio, TX 78212
Tobin Hill NeighborhoodEstimated Value: $352,160 - $483,000
3
Beds
2
Baths
1,494
Sq Ft
$277/Sq Ft
Est. Value
About This Home
This home is located at 504 E Evergreen St, San Antonio, TX 78212 and is currently estimated at $414,540, approximately $277 per square foot. 504 E Evergreen St is a home located in Bexar County with nearby schools including Thomas Edison High School, Nathaniel Hawthorne Academy, and Travis Early College High School.
Ownership History
Date
Name
Owned For
Owner Type
Purchase Details
Closed on
Aug 4, 2009
Sold by
Balderas Balderas Margaret Aranda Margaret Aranda and Balderas Watts Lizabeth
Bought by
Aleman Alexander Octavio and Aleman Ileana R
Current Estimated Value
Home Financials for this Owner
Home Financials are based on the most recent Mortgage that was taken out on this home.
Original Mortgage
$108,500
Outstanding Balance
$71,568
Interest Rate
5.44%
Mortgage Type
Seller Take Back
Estimated Equity
$342,972
Purchase Details
Closed on
Mar 26, 2001
Sold by
Eaton Bernard R
Bought by
Balderas Margaret A
Home Financials for this Owner
Home Financials are based on the most recent Mortgage that was taken out on this home.
Original Mortgage
$30,000
Interest Rate
8.25%
Purchase Details
Closed on
Oct 5, 1993
Sold by
Antoinette Rose Carnesi Trust
Bought by
Balderas Margaret A
Create a Home Valuation Report for This Property
The Home Valuation Report is an in-depth analysis detailing your home's value as well as a comparison with similar homes in the area
Home Values in the Area
Average Home Value in this Area
Purchase History
| Date | Buyer | Sale Price | Title Company |
|---|---|---|---|
| Aleman Alexander Octavio | -- | None Available | |
| Balderas Margaret A | -- | Alamo Title | |
| Balderas Margaret A | -- | -- |
Source: Public Records
Mortgage History
| Date | Status | Borrower | Loan Amount |
|---|---|---|---|
| Open | Aleman Alexander Octavio | $108,500 | |
| Previous Owner | Balderas Margaret A | $30,000 |
Source: Public Records
Tax History Compared to Growth
Tax History
| Year | Tax Paid | Tax Assessment Tax Assessment Total Assessment is a certain percentage of the fair market value that is determined by local assessors to be the total taxable value of land and additions on the property. | Land | Improvement |
|---|---|---|---|---|
| 2025 | $4,332 | $341,456 | $201,950 | $220,300 |
| 2024 | $4,332 | $260,360 | $201,950 | $154,920 |
| 2023 | $4,332 | $236,691 | $201,950 | $168,150 |
| 2022 | $5,830 | $215,174 | $159,670 | $162,020 |
| 2021 | $5,465 | $195,613 | $132,230 | $143,340 |
| 2020 | $5,040 | $177,830 | $132,230 | $148,100 |
| 2019 | $4,633 | $161,664 | $115,010 | $158,800 |
| 2018 | $4,170 | $146,967 | $96,580 | $128,350 |
| 2017 | $3,771 | $133,606 | $96,580 | $108,420 |
| 2016 | $3,428 | $121,460 | $77,060 | $113,390 |
| 2015 | $2,507 | $110,418 | $28,740 | $113,390 |
| 2014 | $2,507 | $100,380 | $0 | $0 |
Source: Public Records
Map
Nearby Homes
- 506 E Evergreen St
- 514 E Laurel
- 616 Wilmington Ave
- 717 E Euclid Ave
- 522 E Myrtle St
- 702 E Euclid Ave
- 617 E Park Ave
- 311 E Evergreen St
- 804 E Euclid Ave
- 810 E Euclid Ave
- 811 E Elmira St Unit 2
- 620 E Myrtle St
- 510 E Locust St
- 727 E Park Ave
- 2104 N Saint Mary's St
- 500 Kendall St
- 508 E Dewey Place
- 719 E Locust St Unit 2104
- 719 E Locust St Unit 4102
- 719 E Locust St Unit 1106
- 516 E Evergreen St
- 110 Gillespie St
- 518 E Evergreen St
- 106 Gillespie St
- 522 E Evergreen St
- 517 E Laurel
- 515 E Laurel
- 521 E Laurel
- 505 E Evergreen St
- 509 E Evergreen St
- 501 E Evergreen St
- 109 Gillespie St
- 511 E Laurel
- 418 E Evergreen St
- 107 Gillespie St Unit 107
- 107 Gillespie St Unit 1
- 515 E Evergreen St
- 524 E Evergreen St
- 527 E Laurel
- 507 E Laurel