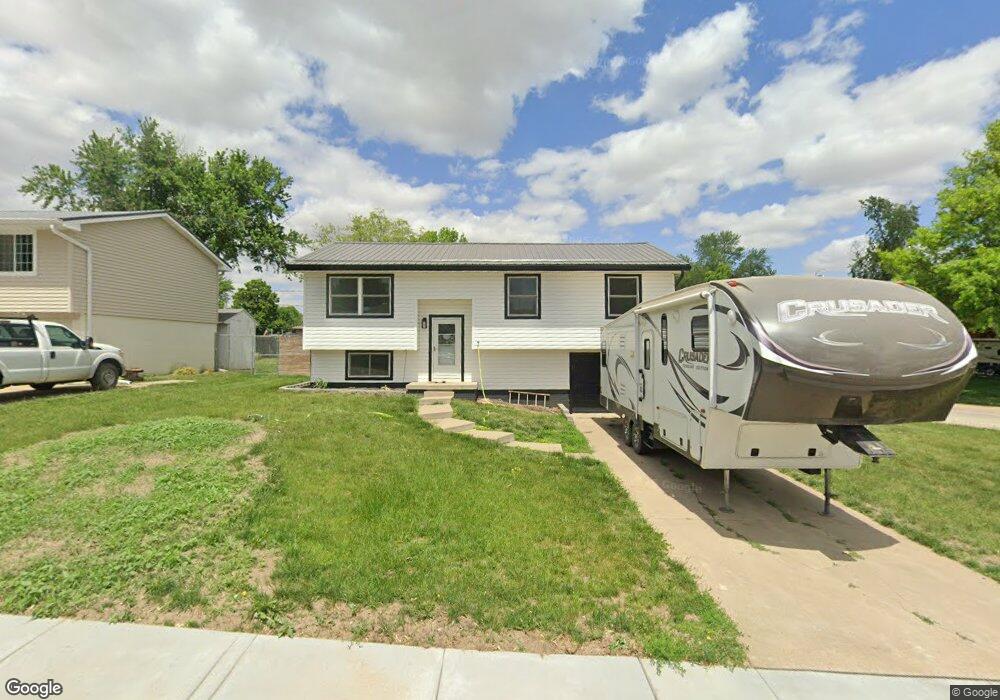
504 Elm St Ceresco, NE 68017
Estimated Value: $233,000 - $267,000
3
Beds
1
Bath
1,030
Sq Ft
$239/Sq Ft
Est. Value
About This Home
This home is located at 504 Elm St, Ceresco, NE 68017 and is currently estimated at $246,592, approximately $239 per square foot. 504 Elm St is a home located in Saunders County with nearby schools including Raymond Central High School.
Ownership History
Date
Name
Owned For
Owner Type
Purchase Details
Closed on
Feb 28, 2019
Sold by
Lacey Tyler L and Lacey Erin M
Bought by
Storm Cory L
Current Estimated Value
Home Financials for this Owner
Home Financials are based on the most recent Mortgage that was taken out on this home.
Original Mortgage
$124,000
Outstanding Balance
$108,351
Interest Rate
4.4%
Mortgage Type
New Conventional
Estimated Equity
$138,241
Purchase Details
Closed on
Sep 29, 2008
Sold by
Nugent Clint and Nugent Rebecca
Bought by
Yarina Martin J and Yarina Jennifer M
Home Financials for this Owner
Home Financials are based on the most recent Mortgage that was taken out on this home.
Original Mortgage
$105,687
Interest Rate
6.57%
Purchase Details
Closed on
Aug 1, 2005
Sold by
Burklund D.L.
Bought by
Nugent Clint and Nugent Rebecca
Home Financials for this Owner
Home Financials are based on the most recent Mortgage that was taken out on this home.
Original Mortgage
$75,000
Interest Rate
5.65%
Create a Home Valuation Report for This Property
The Home Valuation Report is an in-depth analysis detailing your home's value as well as a comparison with similar homes in the area
Purchase History
| Date | Buyer | Sale Price | Title Company |
|---|---|---|---|
| Storm Cory L | $155,000 | Title Services | |
| Yarina Martin J | -- | -- | |
| Nugent Clint | -- | -- |
Source: Public Records
Mortgage History
| Date | Status | Borrower | Loan Amount |
|---|---|---|---|
| Open | Storm Cory L | $124,000 | |
| Previous Owner | Yarina Martin J | $107,272 | |
| Previous Owner | Yarina Martin J | $105,687 | |
| Previous Owner | Nugent Clint | $75,000 |
Source: Public Records
Tax History
| Year | Tax Paid | Tax Assessment Tax Assessment Total Assessment is a certain percentage of the fair market value that is determined by local assessors to be the total taxable value of land and additions on the property. | Land | Improvement |
|---|---|---|---|---|
| 2025 | $2,723 | $191,435 | $25,122 | $166,313 |
| 2024 | $2,778 | $182,549 | $19,260 | $163,289 |
| 2023 | $3,131 | $176,537 | $19,260 | $157,277 |
| 2022 | $3,307 | $168,509 | $19,260 | $149,249 |
| 2021 | $3,020 | $150,598 | $19,260 | $131,338 |
| 2020 | $3,033 | $150,598 | $19,260 | $131,338 |
| 2019 | $2,466 | $121,490 | $19,260 | $102,230 |
| 2018 | $2,507 | $121,490 | $19,260 | $102,230 |
| 2017 | $2,379 | $115,860 | $19,260 | $96,600 |
| 2016 | $2,390 | $96,900 | $20,000 | $76,900 |
| 2015 | $2,070 | $96,900 | $20,000 | $76,900 |
| 2014 | $2,116 | $96,900 | $20,000 | $76,900 |
| 2012 | $2,431 | $96,900 | $20,000 | $76,900 |
Source: Public Records
Map
Nearby Homes
- 704 Beech St
- 0 E Elm St
- 6030 Little Salt Rd
- 551 County Road 20
- 2118 Wilsonville Rd
- 2162 County Road A
- 8645 Agnew Rd
- 5830 Rock Creek Rd
- 135 Hunter St
- 120 Hunter St
- 8601 Agnew Lot 1 Rd
- 8601 Agnew Lot 4 Rd
- 8601 Agnew Lot 3 Rd
- 2415 County Road A
- 1198 County Road D
- 6531 Mill Rd
- 950 County Road 13
- 0 Hwy 77 & County Road I
- 1210 Woodland Rd
- 12550 N 84th St
Your Personal Tour Guide
Ask me questions while you tour the home.