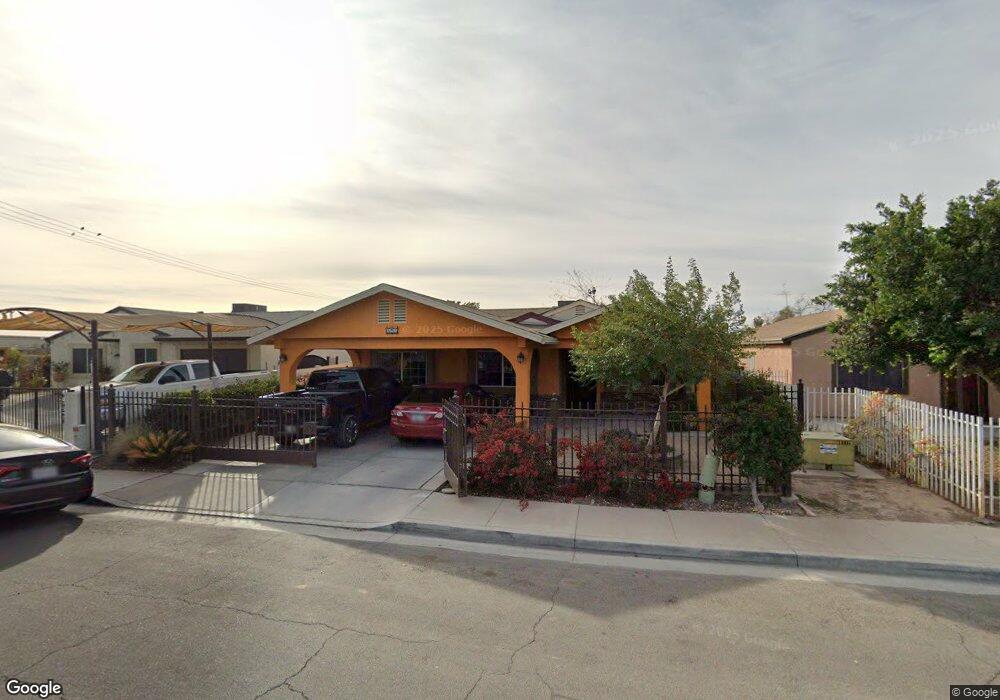
504 Francisco Necochea St Calexico, CA 92231
Estimated Value: $314,204 - $335,000
3
Beds
1
Bath
1,020
Sq Ft
$316/Sq Ft
Est. Value
About This Home
This home is located at 504 Francisco Necochea St, Calexico, CA 92231 and is currently estimated at $322,051, approximately $315 per square foot. 504 Francisco Necochea St is a home located in Imperial County with nearby schools including Mains Elementary School, William Moreno Junior High School, and Calexico High School.
Ownership History
Date
Name
Owned For
Owner Type
Purchase Details
Closed on
Dec 3, 2010
Sold by
Us Bank National Association
Bought by
Rodriguez Guadalupe F and Rodriguez Adriana Z
Current Estimated Value
Purchase Details
Closed on
May 25, 2010
Sold by
Garcia Isabel Ortega
Bought by
U S Bank National Association
Purchase Details
Closed on
Aug 8, 2006
Sold by
Tovar Jesus
Bought by
Garcia Isabel Ortega
Home Financials for this Owner
Home Financials are based on the most recent Mortgage that was taken out on this home.
Original Mortgage
$172,800
Interest Rate
6.7%
Mortgage Type
Stand Alone First
Purchase Details
Closed on
Jun 20, 2005
Sold by
Tovar Graciela
Bought by
Tovar Jesus
Home Financials for this Owner
Home Financials are based on the most recent Mortgage that was taken out on this home.
Original Mortgage
$123,500
Interest Rate
9.5%
Mortgage Type
Stand Alone Refi Refinance Of Original Loan
Create a Home Valuation Report for This Property
The Home Valuation Report is an in-depth analysis detailing your home's value as well as a comparison with similar homes in the area
Home Values in the Area
Average Home Value in this Area
Purchase History
| Date | Buyer | Sale Price | Title Company |
|---|---|---|---|
| Rodriguez Guadalupe F | $79,000 | Advantage Title Inc | |
| U S Bank National Association | $98,570 | Accommodation | |
| Garcia Isabel Ortega | $216,000 | Chicago Title Co | |
| Tovar Jesus | -- | Public |
Source: Public Records
Mortgage History
| Date | Status | Borrower | Loan Amount |
|---|---|---|---|
| Previous Owner | Garcia Isabel Ortega | $172,800 | |
| Previous Owner | Tovar Jesus | $123,500 |
Source: Public Records
Tax History Compared to Growth
Tax History
| Year | Tax Paid | Tax Assessment Tax Assessment Total Assessment is a certain percentage of the fair market value that is determined by local assessors to be the total taxable value of land and additions on the property. | Land | Improvement |
|---|---|---|---|---|
| 2025 | $1,370 | $119,587 | $25,617 | $93,970 |
| 2023 | $1,370 | $114,945 | $24,623 | $90,322 |
| 2022 | $1,324 | $112,692 | $24,141 | $88,551 |
| 2021 | $1,283 | $110,483 | $23,668 | $86,815 |
| 2020 | $1,235 | $109,351 | $23,426 | $85,925 |
| 2019 | $1,198 | $107,208 | $22,967 | $84,241 |
| 2018 | $1,185 | $105,107 | $22,517 | $82,590 |
| 2017 | $1,098 | $103,047 | $22,076 | $80,971 |
| 2016 | $1,046 | $101,028 | $21,644 | $79,384 |
| 2015 | $1,027 | $99,511 | $21,319 | $78,192 |
| 2014 | $837 | $82,563 | $20,902 | $61,661 |
Source: Public Records
Map
Nearby Homes
- 530 W Birch St
- 1324 River Dr
- 937 Lacy Ave
- 1119 Imperial Ave W
- 904 Salvador Guilin St
- 38 Las Flores Dr
- 105 John Kennedy St
- 0 Beech Canal Gate 15 Unit 24368695IC
- 964 Nosotros St
- 1049 Horizon St
- 1245 C N Perry Rd
- 0 California 98
- 814 Rockwood Ave
- 21 E 7th St
- 631 Paulin Ave
- 0 Avenida de Oro
- 711 N Preston Dr
- 722 N Preston Dr
- 0 Sec Carr Rd & Rood Rd Unit 24358721IC
- 1 Towncenter Blvd & Sunset Blvd Blvd
- 508 Francisco Necochea St
- 500 Francisco Necochea St
- 512 Francisco Necochea St
- 505 J M Ostrey St
- 509 J M Ostrey St
- 501 J M Ostrey St
- 513 J M Ostrey St
- 516 Francisco Necochea St
- 505 Francisco Necochea St
- 501 Francisco Necochea St
- 509 Francisco Necochea St
- 517 J M Ostrey St
- 513 Francisco Necochea St
- 520 Francisco Necochea St
- 521 J M Ostrey St
- 517 Francisco Necochea St
- 524 Francisco Necochea St
- 504 Sam Ellis St
- 500 Sam Ellis St
- 508 J M Ostrey St