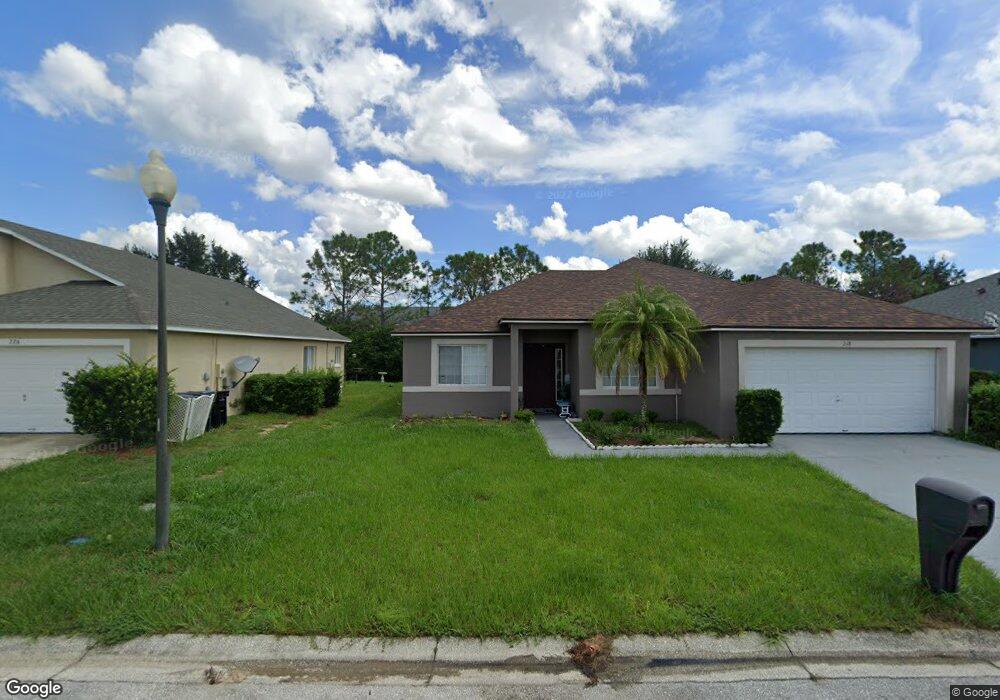
504 Lucaya Loop Davenport, FL 33897
Estimated Value: $186,000 - $193,000
3
Beds
2
Baths
1,232
Sq Ft
$154/Sq Ft
Est. Value
About This Home
This home is located at 504 Lucaya Loop, Davenport, FL 33897 and is currently estimated at $189,430, approximately $153 per square foot. 504 Lucaya Loop is a home located in Polk County with nearby schools including Citrus Ridge Academy: a Civics Academy, Davenport School Of The Arts, and Dundee Elementary Academy.
Ownership History
Date
Name
Owned For
Owner Type
Purchase Details
Closed on
Oct 14, 2022
Sold by
Heneghan Ina and Heneghan Brian Thomas
Bought by
Brian And Ina Heneghan Revocable Family Trust
Current Estimated Value
Purchase Details
Closed on
Apr 21, 2021
Sold by
Cordia Properties Llc
Bought by
Heneghan Ina and Heneghan Brian Thomas
Purchase Details
Closed on
Oct 10, 2018
Sold by
Evergreen Capital Llc
Bought by
Cordia Properties Llc
Purchase Details
Closed on
Aug 18, 2018
Sold by
Wounded Warriors Inc
Bought by
Evergreen Capital Llc
Purchase Details
Closed on
Oct 1, 2007
Sold by
Crisp Andrew and Crisp Andrew K
Bought by
Wounded Warriors Inc
Purchase Details
Closed on
Sep 24, 2003
Sold by
Maesbury Homes Inc
Bought by
Crisp Andrew and Crisp Andrew K
Home Financials for this Owner
Home Financials are based on the most recent Mortgage that was taken out on this home.
Original Mortgage
$135,200
Interest Rate
6.45%
Create a Home Valuation Report for This Property
The Home Valuation Report is an in-depth analysis detailing your home's value as well as a comparison with similar homes in the area
Home Values in the Area
Average Home Value in this Area
Purchase History
| Date | Buyer | Sale Price | Title Company |
|---|---|---|---|
| Brian And Ina Heneghan Revocable Family Trust | $100 | -- | |
| Heneghan Ina | $130,000 | Equitable Ttl Of Celebration | |
| Cordia Properties Llc | -- | Attorney | |
| Evergreen Capital Llc | $107,000 | Liftegrity First Title Llcl | |
| Wounded Warriors Inc | $165,000 | Stewart Title Of Four Corner | |
| Crisp Andrew | $169,000 | -- |
Source: Public Records
Mortgage History
| Date | Status | Borrower | Loan Amount |
|---|---|---|---|
| Previous Owner | Crisp Andrew | $135,200 |
Source: Public Records
Tax History
| Year | Tax Paid | Tax Assessment Tax Assessment Total Assessment is a certain percentage of the fair market value that is determined by local assessors to be the total taxable value of land and additions on the property. | Land | Improvement |
|---|---|---|---|---|
| 2025 | $2,873 | $186,000 | $100 | $185,900 |
| 2024 | $2,841 | $207,000 | $100 | $206,900 |
| 2023 | $2,841 | $202,500 | $100 | $202,400 |
| 2022 | $2,487 | $174,000 | $100 | $173,900 |
| 2021 | $1,422 | $90,500 | $100 | $90,400 |
| 2020 | $1,579 | $102,000 | $100 | $101,900 |
| 2019 | $1,467 | $92,000 | $100 | $91,900 |
| 2018 | $1,182 | $72,000 | $100 | $71,900 |
| 2017 | $1,393 | $87,000 | $0 | $0 |
| 2016 | $1,370 | $83,000 | $0 | $0 |
Source: Public Records
Map
Nearby Homes
- 514 Lucaya Loop Unit 514
- 608 Lucaya Loop Unit 2608
- 411 Lucaya Loop Unit 411
- 615 Lucaya Loop Unit 2615
- 409 Lucaya Loop Unit 4409
- 713 Lucaya Loop Unit 1301
- 703 Lucaya Loop Unit 1103
- 314 Lucaya Loop Unit 5302
- 716 Lucaya Loop Unit 1716
- 312 Lucaya Loop Unit 5312
- 111 Andros Ave Unit 16111
- 103 Rum Run Unit 25103
- 109 New Providence Promenade Unit 109
- 202 Rum Run Unit 36102
- 210 Vista Loop
- 903 Gran Bahama Blvd Unit 903
- 426 Vista Loop
- 104 Vista Loop
- 609 Gran Bahama Blvd Unit 29301
- 301 New Providence Promenade
- 504 Lucaya Loop Unit 3104
- 504 Lucaya Loop Unit B3/U504
- 510 Lucaya Loop Unit 3204
- 510 Lucaya Loop Unit 510
- 505 Lucaya Loop Unit 3105
- 505 Lucaya Loop
- 3503 Lucaya Loop Unit 503
- 515 Lucaya Loop Unit 3515
- 515 Lucaya Loop Unit 3303
- 509 Lucaya Loop Unit 3509
- 511 Lucaya Loop Unit 3511
- 511 Lucaya Loop Unit 3205
- 511 Lucaya Loop 3205 Unit 3205
- 516 Lucaya Loop Unit 3516
- 516 Lucaya Loop 3304 Unit 3-516
- 516 Lucaya Loop Unit 3304
- 516 Lucaya Loop 3304
- 514 Lucaya Loop Unit 3302
- 514 Lucaya Loop Unit 3514
- 514 Lucaya Loop 3302
Your Personal Tour Guide
Ask me questions while you tour the home.