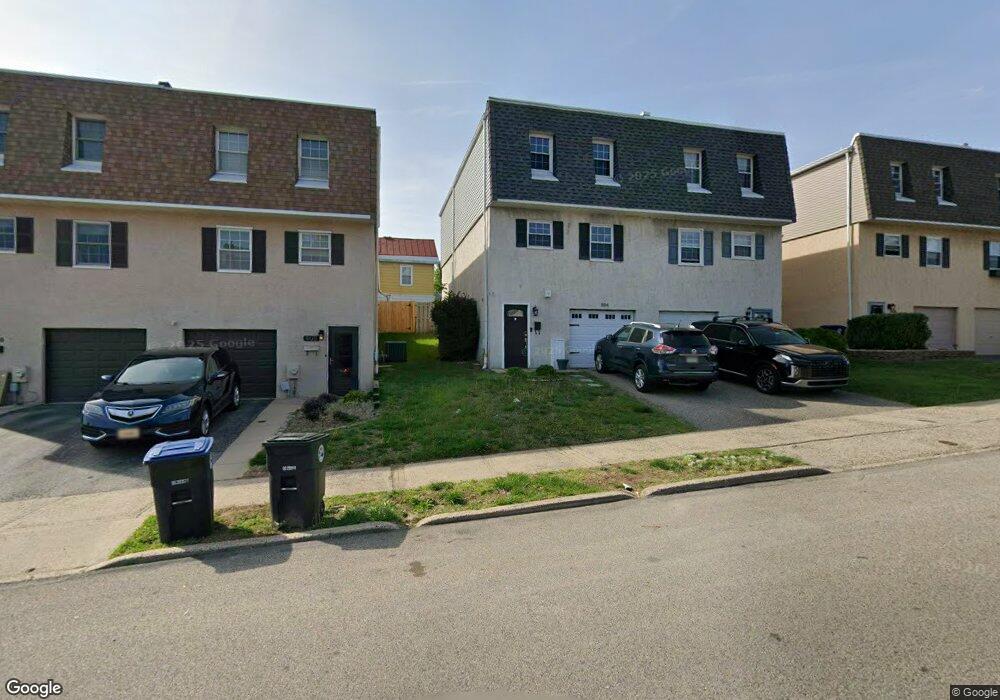
504 Maple St Conshohocken, PA 19428
Estimated Value: $473,276 - $527,000
3
Beds
3
Baths
1,476
Sq Ft
$341/Sq Ft
Est. Value
About This Home
This home is located at 504 Maple St, Conshohocken, PA 19428 and is currently estimated at $503,819, approximately $341 per square foot. 504 Maple St is a home located in Montgomery County with nearby schools including Conshohocken Elementary School, Colonial Elementary School, and Colonial Middle School.
Ownership History
Date
Name
Owned For
Owner Type
Purchase Details
Closed on
May 29, 2013
Sold by
Hoelzle Brian and Hoelzle Lindsey
Bought by
Eisenhart Justin
Current Estimated Value
Home Financials for this Owner
Home Financials are based on the most recent Mortgage that was taken out on this home.
Original Mortgage
$216,000
Outstanding Balance
$153,376
Interest Rate
3.45%
Mortgage Type
New Conventional
Estimated Equity
$350,443
Purchase Details
Closed on
Aug 19, 2003
Sold by
Bennett Paul J
Bought by
Hoelzle Brian
Home Financials for this Owner
Home Financials are based on the most recent Mortgage that was taken out on this home.
Original Mortgage
$227,853
Interest Rate
6.02%
Purchase Details
Closed on
Mar 29, 2002
Sold by
Walker Pamela Lynn
Bought by
Bennett Paul J
Purchase Details
Closed on
May 22, 1996
Sold by
Grossman Michael N and Grossman Theresa A
Bought by
Walker Pamela Lynne
Create a Home Valuation Report for This Property
The Home Valuation Report is an in-depth analysis detailing your home's value as well as a comparison with similar homes in the area
Home Values in the Area
Average Home Value in this Area
Purchase History
| Date | Buyer | Sale Price | Title Company |
|---|---|---|---|
| Eisenhart Justin | $270,000 | None Available | |
| Hoelzle Brian | $234,900 | -- | |
| Bennett Paul J | $185,000 | -- | |
| Walker Pamela Lynne | $125,500 | -- |
Source: Public Records
Mortgage History
| Date | Status | Borrower | Loan Amount |
|---|---|---|---|
| Open | Eisenhart Justin | $216,000 | |
| Previous Owner | Hoelzle Brian | $227,853 |
Source: Public Records
Tax History Compared to Growth
Tax History
| Year | Tax Paid | Tax Assessment Tax Assessment Total Assessment is a certain percentage of the fair market value that is determined by local assessors to be the total taxable value of land and additions on the property. | Land | Improvement |
|---|---|---|---|---|
| 2025 | $3,864 | $111,390 | $17,340 | $94,050 |
| 2024 | $3,864 | $111,390 | $17,340 | $94,050 |
| 2023 | $3,733 | $111,390 | $17,340 | $94,050 |
| 2022 | $3,654 | $111,390 | $17,340 | $94,050 |
| 2021 | $3,552 | $111,390 | $17,340 | $94,050 |
| 2020 | $3,355 | $111,390 | $17,340 | $94,050 |
| 2019 | $3,260 | $111,390 | $17,340 | $94,050 |
| 2018 | $818 | $111,390 | $17,340 | $94,050 |
| 2017 | $3,154 | $111,390 | $17,340 | $94,050 |
| 2016 | $3,110 | $111,390 | $17,340 | $94,050 |
| 2015 | $2,981 | $111,390 | $17,340 | $94,050 |
| 2014 | $2,981 | $111,390 | $17,340 | $94,050 |
Source: Public Records
Map
Nearby Homes
- 635 Wood St
- 326 W 4th Ave
- 345 W 6th Ave
- 215 W 3rd Ave Unit 2
- 33 E 8th Ave Unit 55
- 121 W 2nd Ave
- 148 W 1st Ave
- 133 Sutcliffe Ln
- 219 W 11th Ave
- 222 E 7th Ave
- 140 W 11th Ave
- 79 Harry St
- 350 W Elm St Unit 3207
- 200 W Elm St Unit 1418
- 318 E 6th Ave
- 378 E Hector St
- 333 E Hector St
- 302 E Elm St
- 453 Old Elm St
- 534 Spring Mill Ave