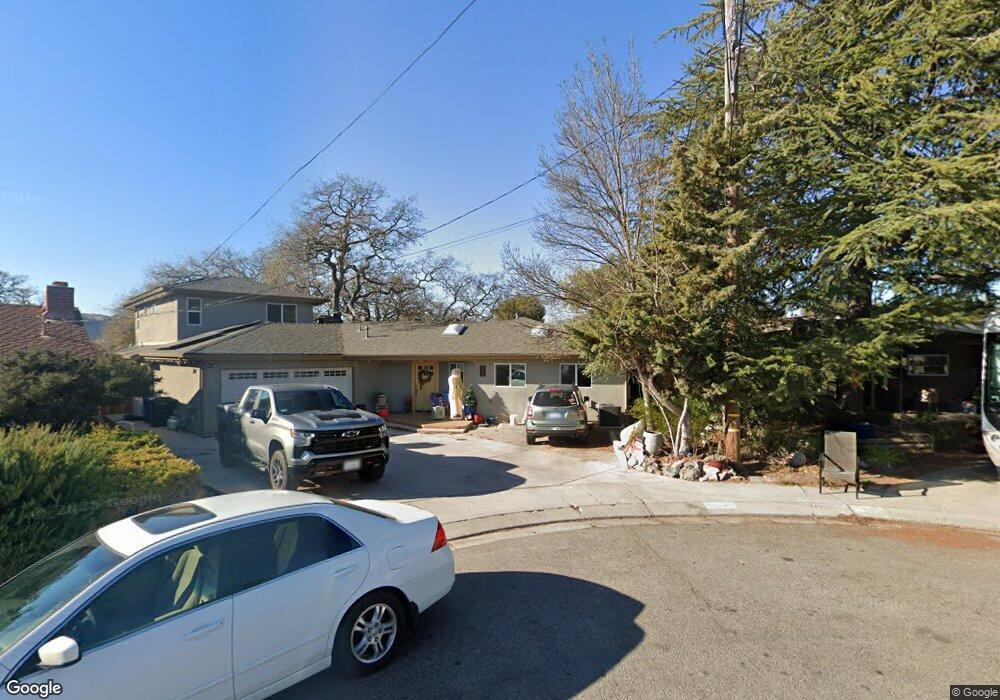
504 Moss Ave Paso Robles, CA 93446
Estimated Value: $697,000 - $940,000
4
Beds
5
Baths
2,740
Sq Ft
$282/Sq Ft
Est. Value
About This Home
This home is located at 504 Moss Ave, Paso Robles, CA 93446 and is currently estimated at $773,227, approximately $282 per square foot. 504 Moss Ave is a home located in San Luis Obispo County with nearby schools including Winifred Pifer Elementary School, Daniel Lewis Middle School, and Paso Robles High School.
Ownership History
Date
Name
Owned For
Owner Type
Purchase Details
Closed on
Jan 28, 2022
Sold by
Amy Boggs
Bought by
City Of Paso Robles
Current Estimated Value
Purchase Details
Closed on
Jun 11, 2013
Sold by
Metzgar Margaret
Bought by
Boggs Christopher and Boggs Amy
Purchase Details
Closed on
Jan 25, 2011
Sold by
Metzgar Margaret
Bought by
Boggs Christopher and Boggs Amy
Purchase Details
Closed on
Dec 29, 2009
Sold by
Metzgar Mark and Metzgar Margaret
Bought by
Metzgar Margaret
Create a Home Valuation Report for This Property
The Home Valuation Report is an in-depth analysis detailing your home's value as well as a comparison with similar homes in the area
Purchase History
| Date | Buyer | Sale Price | Title Company |
|---|---|---|---|
| City Of Paso Robles | -- | None Listed On Document | |
| Boggs Christopher | -- | None Available | |
| Boggs Christopher | -- | None Available | |
| Metzgar Margaret | -- | None Available |
Source: Public Records
Tax History
| Year | Tax Paid | Tax Assessment Tax Assessment Total Assessment is a certain percentage of the fair market value that is determined by local assessors to be the total taxable value of land and additions on the property. | Land | Improvement |
|---|---|---|---|---|
| 2025 | $5,176 | $482,002 | $63,858 | $418,144 |
| 2024 | $5,090 | $472,552 | $62,606 | $409,946 |
| 2023 | $5,090 | $463,287 | $61,379 | $401,908 |
| 2022 | $3,490 | $318,404 | $55,176 | $263,228 |
| 2021 | $2,612 | $239,417 | $54,095 | $185,322 |
| 2020 | $2,576 | $236,963 | $53,541 | $183,422 |
| 2019 | $2,537 | $232,318 | $52,492 | $179,826 |
| 2018 | $2,501 | $227,763 | $51,463 | $176,300 |
| 2017 | $2,351 | $223,298 | $50,454 | $172,844 |
| 2016 | $2,303 | $218,920 | $49,465 | $169,455 |
| 2015 | $2,293 | $215,632 | $48,722 | $166,910 |
| 2014 | $2,212 | $211,409 | $47,768 | $163,641 |
Source: Public Records
Map
Nearby Homes
Your Personal Tour Guide
Ask me questions while you tour the home.