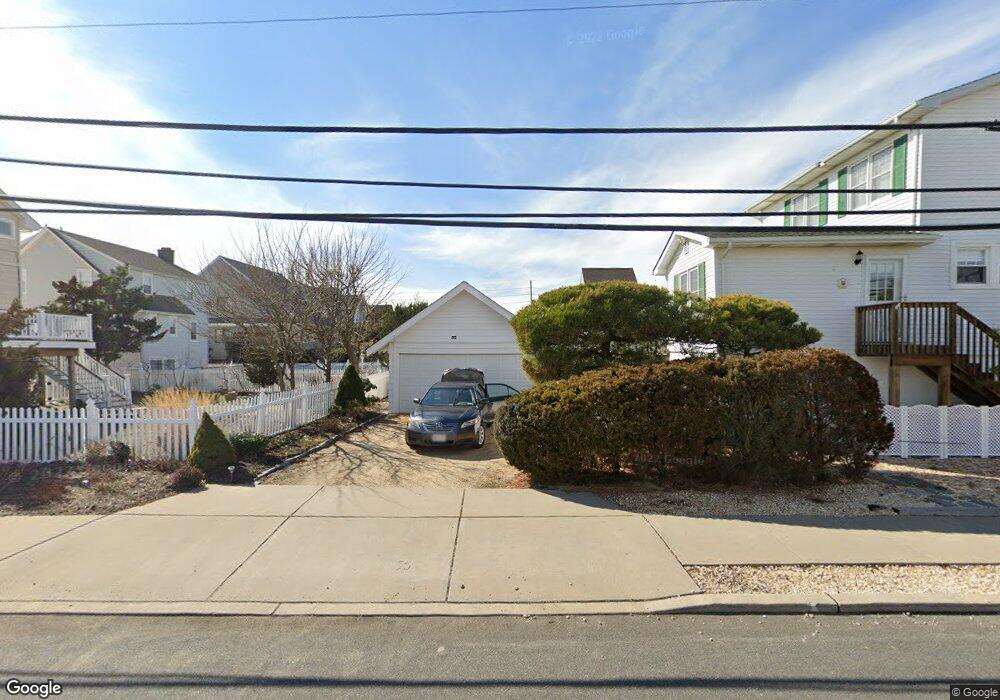
504 N Bayview Ave Seaside Park, NJ 08752
Estimated Value: $1,115,000 - $1,583,000
4
Beds
3
Baths
3,872
Sq Ft
$342/Sq Ft
Est. Value
About This Home
This home is located at 504 N Bayview Ave, Seaside Park, NJ 08752 and is currently estimated at $1,323,421, approximately $341 per square foot. 504 N Bayview Ave is a home located in Ocean County with nearby schools including Central Regional Middle School and Central Regional High School.
Ownership History
Date
Name
Owned For
Owner Type
Purchase Details
Closed on
Jul 27, 2021
Sold by
Misdea Daniel and Misdea Kathleen
Bought by
Misdea Daniel and Misdea Kathleen
Current Estimated Value
Home Financials for this Owner
Home Financials are based on the most recent Mortgage that was taken out on this home.
Original Mortgage
$592,000
Outstanding Balance
$536,681
Interest Rate
2.7%
Mortgage Type
New Conventional
Estimated Equity
$786,740
Purchase Details
Closed on
Sep 10, 2008
Sold by
Friedland Wayne
Bought by
Misdea Daniel and Misdea Kathleen
Home Financials for this Owner
Home Financials are based on the most recent Mortgage that was taken out on this home.
Original Mortgage
$395,000
Interest Rate
6.54%
Mortgage Type
Purchase Money Mortgage
Purchase Details
Closed on
Dec 12, 2003
Sold by
Swavely Jennifer L
Bought by
Friedland Family Trust
Create a Home Valuation Report for This Property
The Home Valuation Report is an in-depth analysis detailing your home's value as well as a comparison with similar homes in the area
Home Values in the Area
Average Home Value in this Area
Purchase History
| Date | Buyer | Sale Price | Title Company |
|---|---|---|---|
| Misdea Daniel | $300,000 | All Ahead Title Agency | |
| Misdea Daniel | $885,000 | Vested Title Inc | |
| Friedland Family Trust | $610,000 | -- |
Source: Public Records
Mortgage History
| Date | Status | Borrower | Loan Amount |
|---|---|---|---|
| Open | Misdea Daniel | $592,000 | |
| Previous Owner | Misdea Daniel | $395,000 |
Source: Public Records
Tax History Compared to Growth
Tax History
| Year | Tax Paid | Tax Assessment Tax Assessment Total Assessment is a certain percentage of the fair market value that is determined by local assessors to be the total taxable value of land and additions on the property. | Land | Improvement |
|---|---|---|---|---|
| 2025 | $9,816 | $600,000 | $425,900 | $174,100 |
| 2024 | $9,654 | $600,000 | $425,900 | $174,100 |
| 2023 | $9,312 | $600,000 | $425,900 | $174,100 |
| 2022 | $9,312 | $600,000 | $425,900 | $174,100 |
| 2021 | $9,114 | $600,000 | $425,900 | $174,100 |
| 2020 | $11,738 | $781,000 | $492,900 | $288,100 |
| 2019 | $7,758 | $521,700 | $492,900 | $28,800 |
| 2018 | $7,252 | $521,700 | $492,900 | $28,800 |
| 2017 | $7,361 | $521,700 | $492,900 | $28,800 |
| 2016 | $6,845 | $521,700 | $492,900 | $28,800 |
| 2015 | $7,142 | $521,700 | $492,900 | $28,800 |
| 2014 | $6,824 | $521,700 | $492,900 | $28,800 |
Source: Public Records
Map
Nearby Homes