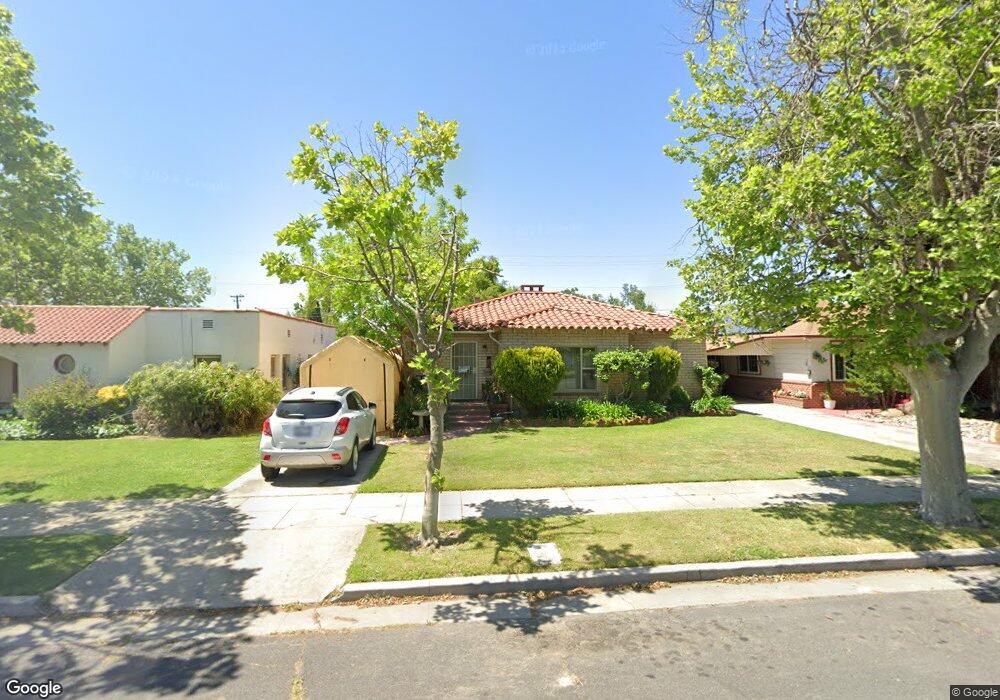
504 N G St Madera, CA 93637
Downtown Madera NeighborhoodEstimated Value: $281,000 - $319,508
3
Beds
1
Bath
1,364
Sq Ft
$218/Sq Ft
Est. Value
About This Home
This home is located at 504 N G St, Madera, CA 93637 and is currently estimated at $297,127, approximately $217 per square foot. 504 N G St is a home located in Madera County with nearby schools including James Madison Elementary School, Thomas Jefferson Middle School, and Madera High School.
Ownership History
Date
Name
Owned For
Owner Type
Purchase Details
Closed on
Apr 15, 2025
Sold by
Franklin Donald Ray
Bought by
Treckeme Michelle
Current Estimated Value
Home Financials for this Owner
Home Financials are based on the most recent Mortgage that was taken out on this home.
Original Mortgage
$250,000
Outstanding Balance
$248,895
Interest Rate
6.67%
Mortgage Type
Seller Take Back
Estimated Equity
$48,232
Create a Home Valuation Report for This Property
The Home Valuation Report is an in-depth analysis detailing your home's value as well as a comparison with similar homes in the area
Home Values in the Area
Average Home Value in this Area
Purchase History
| Date | Buyer | Sale Price | Title Company |
|---|---|---|---|
| Treckeme Michelle | $280,000 | Fidelity National Title Compan |
Source: Public Records
Mortgage History
| Date | Status | Borrower | Loan Amount |
|---|---|---|---|
| Open | Treckeme Michelle | $250,000 |
Source: Public Records
Tax History Compared to Growth
Tax History
| Year | Tax Paid | Tax Assessment Tax Assessment Total Assessment is a certain percentage of the fair market value that is determined by local assessors to be the total taxable value of land and additions on the property. | Land | Improvement |
|---|---|---|---|---|
| 2025 | $1,108 | $93,762 | $34,441 | $59,321 |
| 2023 | $1,108 | $90,122 | $33,104 | $57,018 |
| 2022 | $1,036 | $88,355 | $32,455 | $55,900 |
| 2021 | $1,017 | $86,623 | $31,819 | $54,804 |
| 2020 | $1,036 | $85,736 | $31,493 | $54,243 |
| 2019 | $1,028 | $84,056 | $30,876 | $53,180 |
| 2018 | $950 | $82,409 | $30,271 | $52,138 |
| 2017 | $939 | $80,794 | $29,678 | $51,116 |
| 2016 | $916 | $79,211 | $29,097 | $50,114 |
| 2015 | $886 | $78,022 | $28,660 | $49,362 |
| 2014 | $828 | $76,495 | $28,099 | $48,396 |
Source: Public Records
Map
Nearby Homes