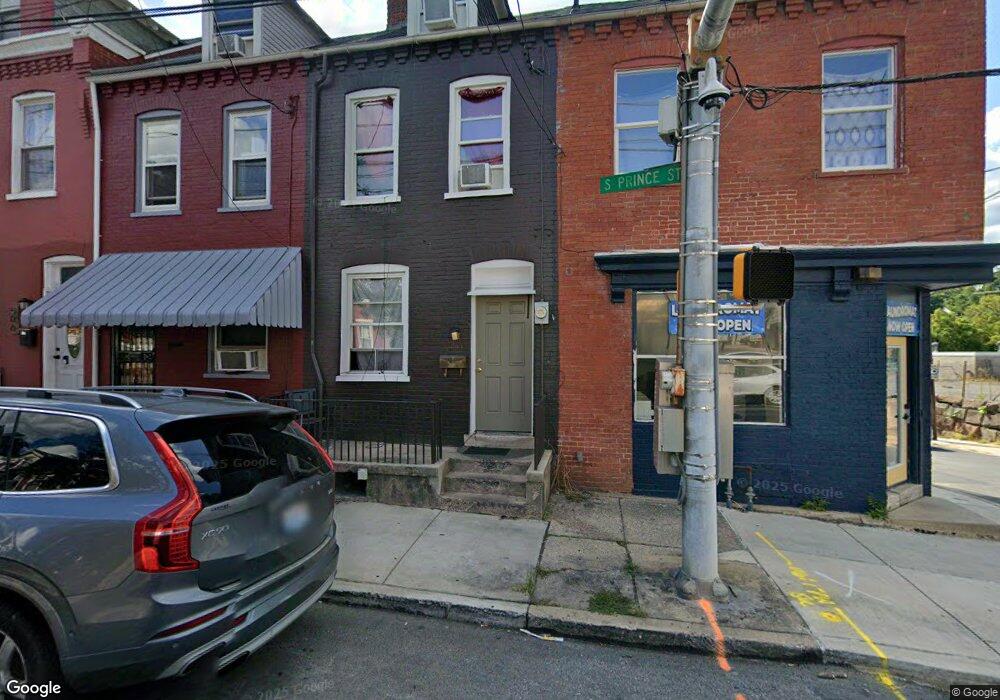
504 S Prince St Lancaster, PA 17603
Southside Lancaster NeighborhoodEstimated Value: $127,000 - $174,000
2
Beds
1
Bath
1,131
Sq Ft
$134/Sq Ft
Est. Value
About This Home
This home is located at 504 S Prince St, Lancaster, PA 17603 and is currently estimated at $151,364, approximately $133 per square foot. 504 S Prince St is a home located in Lancaster County with nearby schools including Price Elementary School, Jackson Middle School, and McCaskey High School.
Ownership History
Date
Name
Owned For
Owner Type
Purchase Details
Closed on
Feb 12, 2024
Sold by
Gearhart Ryan L
Bought by
Stoltzfus Jonas F
Current Estimated Value
Home Financials for this Owner
Home Financials are based on the most recent Mortgage that was taken out on this home.
Original Mortgage
$92,800
Outstanding Balance
$91,163
Interest Rate
6.62%
Mortgage Type
New Conventional
Estimated Equity
$60,201
Purchase Details
Closed on
Sep 15, 2020
Sold by
Rutt David K and Rutt Dale Railing
Bought by
Gearbart Ryan L
Home Financials for this Owner
Home Financials are based on the most recent Mortgage that was taken out on this home.
Original Mortgage
$603,900
Interest Rate
2.9%
Mortgage Type
Seller Take Back
Purchase Details
Closed on
Feb 24, 2005
Sold by
Lancaster County Tax Claim Bureau
Bought by
Rutt David K and Railing Dale
Create a Home Valuation Report for This Property
The Home Valuation Report is an in-depth analysis detailing your home's value as well as a comparison with similar homes in the area
Home Values in the Area
Average Home Value in this Area
Purchase History
| Date | Buyer | Sale Price | Title Company |
|---|---|---|---|
| Stoltzfus Jonas F | $116,000 | None Listed On Document | |
| Gearbart Ryan L | $671,000 | None Available | |
| Rutt David K | $16,900 | -- |
Source: Public Records
Mortgage History
| Date | Status | Borrower | Loan Amount |
|---|---|---|---|
| Open | Stoltzfus Jonas F | $92,800 | |
| Previous Owner | Gearbart Ryan L | $603,900 |
Source: Public Records
Tax History Compared to Growth
Tax History
| Year | Tax Paid | Tax Assessment Tax Assessment Total Assessment is a certain percentage of the fair market value that is determined by local assessors to be the total taxable value of land and additions on the property. | Land | Improvement |
|---|---|---|---|---|
| 2025 | $1,765 | $44,600 | $5,600 | $39,000 |
| 2024 | $1,765 | $44,600 | $5,600 | $39,000 |
| 2023 | $1,735 | $44,600 | $5,600 | $39,000 |
| 2022 | $1,663 | $44,600 | $5,600 | $39,000 |
| 2021 | $1,627 | $44,600 | $5,600 | $39,000 |
| 2020 | $1,627 | $44,600 | $5,600 | $39,000 |
| 2019 | $1,603 | $44,600 | $5,600 | $39,000 |
| 2018 | $951 | $44,600 | $5,600 | $39,000 |
| 2017 | $1,709 | $37,200 | $4,300 | $32,900 |
| 2016 | $1,693 | $37,200 | $4,300 | $32,900 |
| 2015 | $660 | $37,200 | $4,300 | $32,900 |
| 2014 | $1,478 | $37,200 | $4,300 | $32,900 |
Source: Public Records
Map
Nearby Homes
- 506 Beaver St
- 543 S Prince St
- 459 S Queen St
- 429 Hillside Ave
- 348 S Prince St
- 346 S Prince St
- 471 New Dorwart St
- 341 S Prince St
- 472 New Dorwart St
- 316 Beaver St
- 641 S Queen St
- 555 Woodward St
- 536 Woodward St
- 507 Locust St
- 513 Howard Ave
- 462 S Christian St
- 442 Fremont St
- 458 Poplar St
- 828 Highland Ave
- 659 Fremont St
- 504 S Prince St
- 506 S Prince St
- 508 S Prince St
- 510 S Prince St
- 503 S Prince St
- 501 S Prince St
- 505 S Prince St
- 507 S Prince St
- 463 S Prince St
- 509 S Prince St
- 461 S Prince St
- 513 S Prince St
- 444 S Prince St
- 204 Hazel St
- 515 S Prince St
- 457 S Prince St
- 519 1/2 S Prince St
- 517 S Prince St
- 536 S Prince St
- 36 St