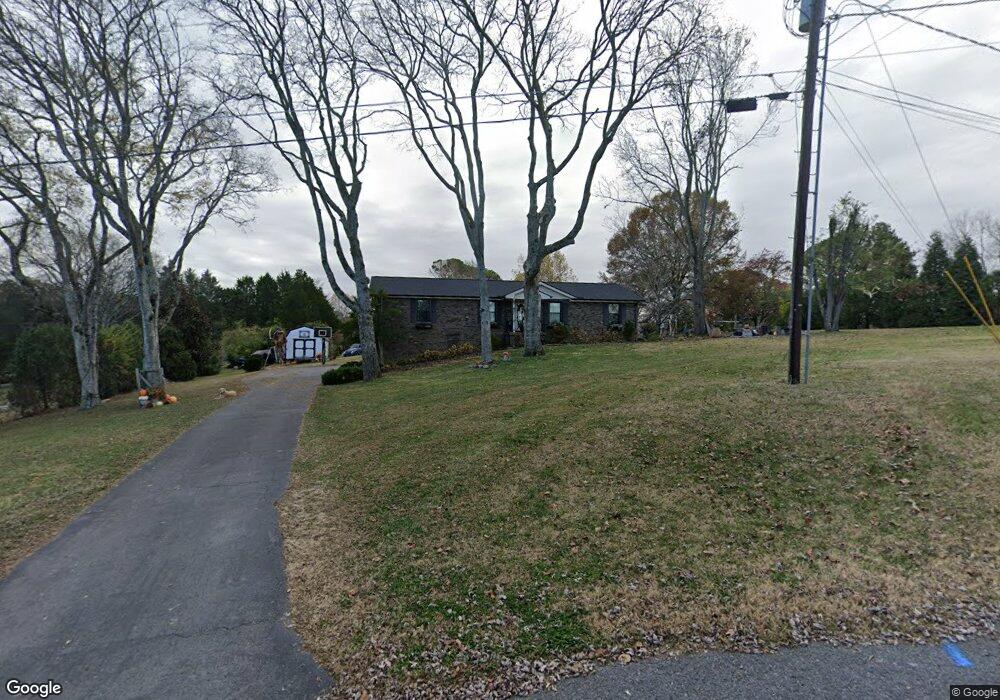
504 Suzanne Ct Mount Juliet, TN 37122
Estimated Value: $417,000 - $502,000
--
Bed
2
Baths
1,600
Sq Ft
$297/Sq Ft
Est. Value
About This Home
This home is located at 504 Suzanne Ct, Mount Juliet, TN 37122 and is currently estimated at $475,711, approximately $297 per square foot. 504 Suzanne Ct is a home located in Wilson County with nearby schools including Lakeview Elementary School, Mt. Juliet Middle School, and Green Hill High School.
Ownership History
Date
Name
Owned For
Owner Type
Purchase Details
Closed on
Sep 12, 2013
Sold by
Kelley Stacy D
Bought by
Tucker Richard D and Tucker Alicia G
Current Estimated Value
Home Financials for this Owner
Home Financials are based on the most recent Mortgage that was taken out on this home.
Original Mortgage
$197,600
Outstanding Balance
$147,397
Interest Rate
4.39%
Mortgage Type
Commercial
Estimated Equity
$328,314
Purchase Details
Closed on
Oct 12, 2007
Sold by
Blackburn Michael A
Bought by
Kelley Stacy D
Purchase Details
Closed on
Mar 8, 2000
Sold by
Durden Joe S
Bought by
Blackburn Michael A & Sta
Purchase Details
Closed on
Jul 31, 1991
Bought by
Durden Joe S and Durden Joyce J
Purchase Details
Closed on
Dec 2, 1987
Bought by
Smithson Bobby C
Purchase Details
Closed on
Oct 22, 1986
Bought by
Smithson Bobby C Mtg Corporation Of Sout
Purchase Details
Closed on
Nov 8, 1985
Bought by
Thomas George L and Thomas Dora P
Create a Home Valuation Report for This Property
The Home Valuation Report is an in-depth analysis detailing your home's value as well as a comparison with similar homes in the area
Home Values in the Area
Average Home Value in this Area
Purchase History
| Date | Buyer | Sale Price | Title Company |
|---|---|---|---|
| Tucker Richard D | $208,000 | -- | |
| Kelley Stacy D | -- | -- | |
| Blackburn Michael A & Sta | $130,000 | -- | |
| Durden Joe S | $99,500 | -- | |
| Smithson Bobby C | -- | -- | |
| Smithson Bobby C Mtg Corporation Of Sout | -- | -- | |
| Thomas George L | -- | -- |
Source: Public Records
Mortgage History
| Date | Status | Borrower | Loan Amount |
|---|---|---|---|
| Open | Tucker Richard D | $197,600 |
Source: Public Records
Tax History Compared to Growth
Tax History
| Year | Tax Paid | Tax Assessment Tax Assessment Total Assessment is a certain percentage of the fair market value that is determined by local assessors to be the total taxable value of land and additions on the property. | Land | Improvement |
|---|---|---|---|---|
| 2024 | $1,147 | $60,075 | $15,000 | $45,075 |
| 2022 | $1,147 | $60,075 | $15,000 | $45,075 |
| 2021 | $1,147 | $60,075 | $15,000 | $45,075 |
| 2020 | $1,322 | $60,075 | $15,000 | $45,075 |
| 2019 | $1,322 | $52,500 | $10,800 | $41,700 |
| 2018 | $1,322 | $52,500 | $10,800 | $41,700 |
| 2017 | $1,322 | $52,500 | $10,800 | $41,700 |
| 2016 | $1,322 | $52,500 | $10,800 | $41,700 |
| 2015 | $1,349 | $52,500 | $10,800 | $41,700 |
| 2014 | $1,072 | $41,716 | $0 | $0 |
Source: Public Records
Map
Nearby Homes
- 741 Saundersville Ferry Rd
- 589 Saundersville Ferry Rd
- 877 Saundersville Ferry Rd
- 3860 Saundersville Ferry Rd
- 2005 Earl Pearce Cir
- 1003 Bellwood Dr
- 3009 Nottingham Cir
- 306 Estate Dr
- 320 Estate Dr
- 316 River Dr
- 1 Saundersville Ferry Rd
- 1337 Vanderbilt Rd
- 2027 Hunters Place
- 1809 Hidden Ridge Cir
- 5493 Vanderbilt Rd
- 1041 Cedar Creek Village Rd
- 310 Weeping Elm Rd
- 4245 Nonaville Rd
- 120 Ravens Crest Ave
- 802 Crystal Ct
- 505 Suzanne Ct
- 503 Suzanne Ct
- 506 Suzanne Ct
- 905 Green Valley Rd
- 105 Samantha Ct
- 708 Glen Oaks Dr
- 501 Suzanne Ct
- 502 Suzanne Ct
- 702 Glen Oaks Dr
- 911 Green Valley Rd
- 903 Green Valley Rd
- 102 Samantha Ct
- 705 Glen Oaks Dr
- 100 Samantha Ct
- 107 Samantha Ct
- 707 Glen Oaks Dr
- 701 Hillbrook Dr
- 700 Glen Oaks Dr
- 707 Hillbrook Dr