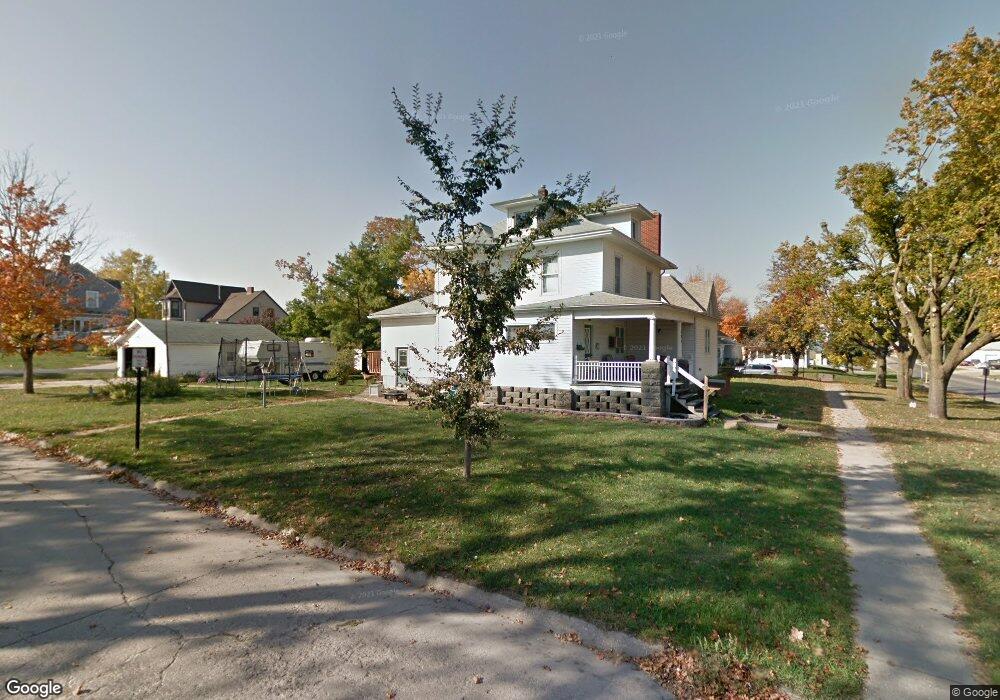
504 W 4th St Vinton, IA 52349
Estimated Value: $171,028 - $224,000
3
Beds
3
Baths
2,138
Sq Ft
$91/Sq Ft
Est. Value
About This Home
This home is located at 504 W 4th St, Vinton, IA 52349 and is currently estimated at $195,507, approximately $91 per square foot. 504 W 4th St is a home located in Benton County with nearby schools including Tilford Elementary School, Shellsburg Elementary School, and Vinton-Shellsburg Middle School.
Ownership History
Date
Name
Owned For
Owner Type
Purchase Details
Closed on
Dec 31, 2010
Sold by
White Marvin Dean and White Monika D
Bought by
Kearns Daniel W and Kearns Heather
Current Estimated Value
Home Financials for this Owner
Home Financials are based on the most recent Mortgage that was taken out on this home.
Original Mortgage
$91,200
Interest Rate
4.44%
Mortgage Type
New Conventional
Create a Home Valuation Report for This Property
The Home Valuation Report is an in-depth analysis detailing your home's value as well as a comparison with similar homes in the area
Home Values in the Area
Average Home Value in this Area
Purchase History
| Date | Buyer | Sale Price | Title Company |
|---|---|---|---|
| Kearns Daniel W | -- | -- |
Source: Public Records
Mortgage History
| Date | Status | Borrower | Loan Amount |
|---|---|---|---|
| Closed | Kearns Daniel W | $91,200 |
Source: Public Records
Tax History Compared to Growth
Tax History
| Year | Tax Paid | Tax Assessment Tax Assessment Total Assessment is a certain percentage of the fair market value that is determined by local assessors to be the total taxable value of land and additions on the property. | Land | Improvement |
|---|---|---|---|---|
| 2025 | $2,140 | $157,500 | $15,100 | $142,400 |
| 2024 | $2,140 | $141,300 | $14,500 | $126,800 |
| 2023 | $2,138 | $141,300 | $14,500 | $126,800 |
| 2022 | $2,192 | $115,000 | $11,600 | $103,400 |
| 2021 | $2,192 | $115,000 | $11,600 | $103,400 |
| 2020 | $2,240 | $119,000 | $12,900 | $106,100 |
| 2019 | $2,162 | $119,000 | $12,900 | $106,100 |
| 2018 | $2,094 | $113,700 | $12,400 | $101,300 |
| 2017 | $2,002 | $113,700 | $12,400 | $101,300 |
| 2016 | $2,294 | $106,300 | $11,600 | $94,700 |
| 2015 | $2,106 | $106,300 | $11,600 | $94,700 |
| 2014 | $2,240 | $105,800 | $0 | $0 |
Source: Public Records
Map
Nearby Homes