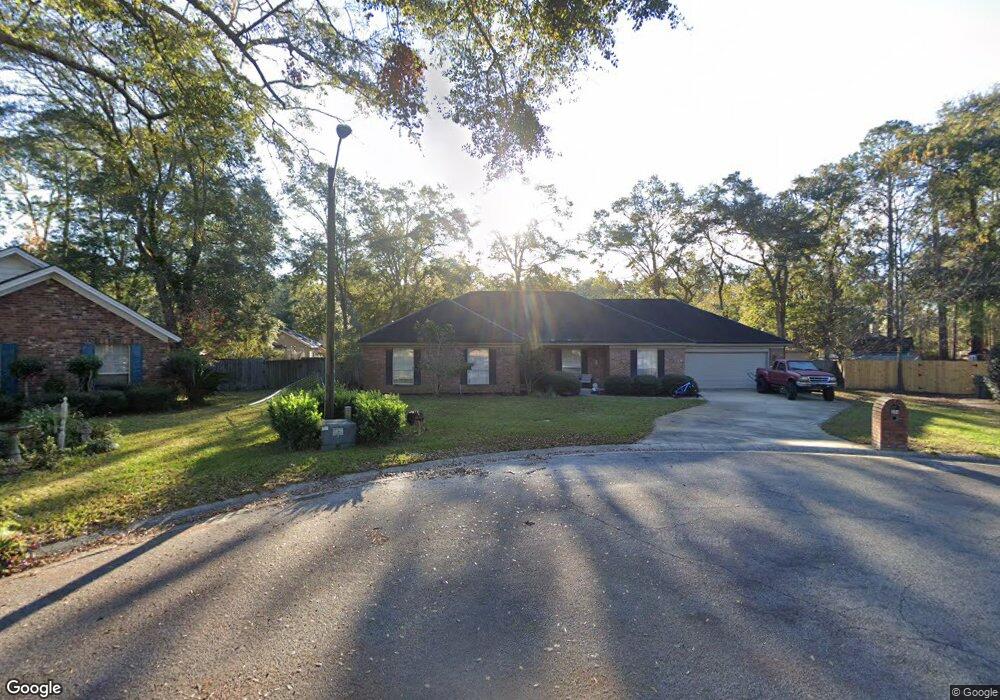
504 Waverly Ct Hinesville, GA 31313
Estimated Value: $291,467 - $317,000
4
Beds
2
Baths
2,488
Sq Ft
$122/Sq Ft
Est. Value
About This Home
This home is located at 504 Waverly Ct, Hinesville, GA 31313 and is currently estimated at $302,867, approximately $121 per square foot. 504 Waverly Ct is a home located in Liberty County with nearby schools including Button Gwinnett Elementary School, Snelson-Golden Middle School, and Bradwell Institute.
Ownership History
Date
Name
Owned For
Owner Type
Purchase Details
Closed on
Aug 29, 2014
Sold by
Burns Anthony M
Bought by
Fountain Bryan A
Current Estimated Value
Home Financials for this Owner
Home Financials are based on the most recent Mortgage that was taken out on this home.
Original Mortgage
$191,939
Outstanding Balance
$147,213
Interest Rate
4.19%
Mortgage Type
VA
Estimated Equity
$155,654
Purchase Details
Closed on
Aug 27, 2007
Sold by
Kirkwood John
Bought by
Burns Anthony M and Burns Paige K
Home Financials for this Owner
Home Financials are based on the most recent Mortgage that was taken out on this home.
Original Mortgage
$122,724
Interest Rate
6.65%
Mortgage Type
New Conventional
Purchase Details
Closed on
May 28, 2002
Sold by
Young Jeffrey M and Young Monika
Bought by
Kirkwood John W and Kirkwood Nancy A
Purchase Details
Closed on
Jan 30, 2001
Sold by
Vanwyk Rustan J
Bought by
Young Jeffrey M and Young Monika
Purchase Details
Closed on
Dec 1, 1997
Sold by
Gagliardi Frank
Bought by
Vanwyk Rustan J
Purchase Details
Closed on
Mar 2, 1992
Sold by
Hallmark Homes Inc
Bought by
Gagliardi Frank
Purchase Details
Closed on
Nov 13, 1991
Bought by
Hallmark Homes Inc
Create a Home Valuation Report for This Property
The Home Valuation Report is an in-depth analysis detailing your home's value as well as a comparison with similar homes in the area
Home Values in the Area
Average Home Value in this Area
Purchase History
| Date | Buyer | Sale Price | Title Company |
|---|---|---|---|
| Fountain Bryan A | $187,900 | -- | |
| Burns Anthony M | $194,500 | -- | |
| Kirkwood John W | $145,500 | -- | |
| Young Jeffrey M | $128,300 | -- | |
| Vanwyk Rustan J | $126,000 | -- | |
| Gagliardi Frank | $110,000 | -- | |
| Hallmark Homes Inc | $14,000 | -- |
Source: Public Records
Mortgage History
| Date | Status | Borrower | Loan Amount |
|---|---|---|---|
| Open | Fountain Bryan A | $191,939 | |
| Previous Owner | Burns Anthony M | $122,724 |
Source: Public Records
Tax History Compared to Growth
Tax History
| Year | Tax Paid | Tax Assessment Tax Assessment Total Assessment is a certain percentage of the fair market value that is determined by local assessors to be the total taxable value of land and additions on the property. | Land | Improvement |
|---|---|---|---|---|
| 2024 | $5,506 | $112,319 | $14,000 | $98,319 |
| 2023 | $5,506 | $100,996 | $14,000 | $86,996 |
| 2022 | $3,876 | $83,438 | $14,000 | $69,438 |
| 2021 | $3,453 | $72,933 | $14,000 | $58,933 |
| 2020 | $3,213 | $67,186 | $12,800 | $54,386 |
| 2019 | $3,191 | $67,232 | $12,800 | $54,432 |
| 2018 | $3,208 | $67,974 | $12,800 | $55,174 |
| 2017 | $2,353 | $71,466 | $12,800 | $58,666 |
| 2016 | $3,251 | $72,336 | $12,800 | $59,536 |
| 2015 | $2,878 | $72,336 | $12,800 | $59,536 |
| 2014 | $2,878 | $67,004 | $12,800 | $54,204 |
| 2013 | -- | $83,403 | $14,000 | $69,403 |
Source: Public Records
Map
Nearby Homes
- 520 Wellington Way
- 489 Elm St
- 617 Oak St
- 0 County Line Rd Unit 1644022
- 0 County Line Rd Unit 18961791
- 614 Demere St
- 615 Scott St
- 201 Ash Blvd
- 668 Windhaven Dr
- 664 Windhaven Dr
- 740 Robin Hood Dr
- 22 Oak St
- 509 Franklin St
- 505 Franklin St
- 731 Robin Hood Dr
- 108 Cherrydale St
- 313 Deal St
- 125 Stafford St
- 480 Dykes St
- 502 Waverly Ct
- 506 Wellington Way
- 505 Waverly Ct
- 504 Wellington Way
- 508 Wellington Way Unit 65
- 508 Wellington Way
- 502 Wellington Way
- 415 Arlington Dr
- 503 Waverly Ct
- 413 Arlington Dr
- 400 Richmond Ln
- 411 Arlington Dr
- 402 Richmond Ln
- 500 Wellington Way
- 404 Richmond Ln
- 0 Arlington Dr Unit 7111472
- 0 Arlington Dr Unit 8521684
- 0 Arlington Dr
- 511 Wellington Way
- 425 Arlington Dr