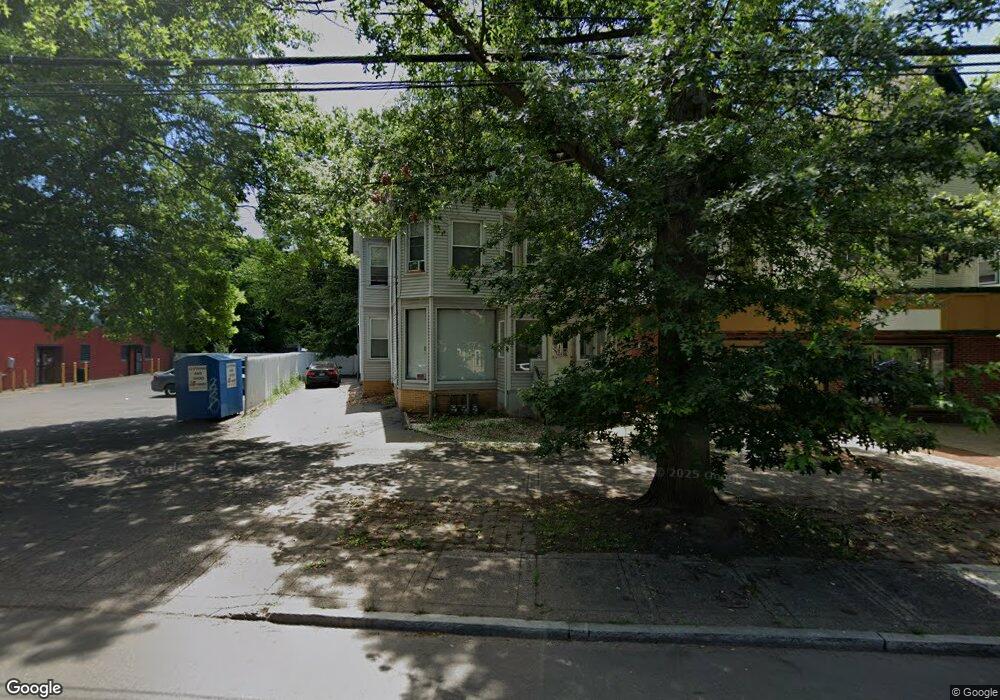
504 Whalley Ave New Haven, CT 06511
Edgewood NeighborhoodEstimated Value: $1,145,606
--
Bed
1
Bath
--
Sq Ft
5,750
Sq Ft Lot
About This Home
This home is located at 504 Whalley Ave, New Haven, CT 06511 and is currently estimated at $1,145,606. 504 Whalley Ave is a home located in New Haven County with nearby schools including Elm City Montessori School and Yeshiva Gedolah Rabbinical Inst.
Ownership History
Date
Name
Owned For
Owner Type
Purchase Details
Closed on
Mar 31, 2017
Bought by
Nhvn Whalley 504 Llc
Current Estimated Value
Home Financials for this Owner
Home Financials are based on the most recent Mortgage that was taken out on this home.
Original Mortgage
$420,000
Outstanding Balance
$348,928
Interest Rate
4.15%
Mortgage Type
Commercial
Estimated Equity
$796,678
Purchase Details
Closed on
Jun 23, 2014
Sold by
Larin Realty Corp
Bought by
Nittany Holdings Llc
Purchase Details
Closed on
Jun 3, 2014
Sold by
506 Whalley Avenue Llc
Bought by
Larin Realty Corp
Purchase Details
Closed on
Oct 10, 2007
Sold by
J&B Development Llc
Bought by
506 Whalley Avenue Llc
Home Financials for this Owner
Home Financials are based on the most recent Mortgage that was taken out on this home.
Original Mortgage
$368,000
Interest Rate
8.38%
Mortgage Type
Commercial
Purchase Details
Closed on
Jun 19, 1997
Sold by
South West Federated
Bought by
J & B Dev Llc
Create a Home Valuation Report for This Property
The Home Valuation Report is an in-depth analysis detailing your home's value as well as a comparison with similar homes in the area
Home Values in the Area
Average Home Value in this Area
Purchase History
| Date | Buyer | Sale Price | Title Company |
|---|---|---|---|
| Nhvn Whalley 504 Llc | -- | -- | |
| Nhvn Whalley 504 Llc | -- | -- | |
| Better Homes Llc | $600,000 | -- | |
| Nittany Holdings Llc | -- | -- | |
| Larin Realty Corp | $598,424 | -- | |
| 506 Whalley Avenue Llc | $460,000 | -- | |
| J & B Dev Llc | $185,201 | -- |
Source: Public Records
Mortgage History
| Date | Status | Borrower | Loan Amount |
|---|---|---|---|
| Open | J & B Dev Llc | $420,000 | |
| Closed | J & B Dev Llc | $420,000 | |
| Previous Owner | J & B Dev Llc | $368,000 |
Source: Public Records
Tax History Compared to Growth
Tax History
| Year | Tax Paid | Tax Assessment Tax Assessment Total Assessment is a certain percentage of the fair market value that is determined by local assessors to be the total taxable value of land and additions on the property. | Land | Improvement |
|---|---|---|---|---|
| 2025 | $8,963 | $213,920 | $73,080 | $140,840 |
| 2024 | $8,736 | $213,920 | $73,080 | $140,840 |
| 2023 | $8,493 | $213,920 | $73,080 | $140,840 |
| 2022 | $8,967 | $213,920 | $73,080 | $140,840 |
| 2021 | $8,387 | $182,140 | $56,210 | $125,930 |
| 2020 | $8,369 | $182,140 | $56,210 | $125,930 |
| 2019 | $8,187 | $182,140 | $56,210 | $125,930 |
| 2018 | $8,187 | $182,140 | $56,210 | $125,930 |
| 2017 | $7,045 | $182,140 | $56,210 | $125,930 |
| 2016 | $6,873 | $165,410 | $50,890 | $114,520 |
| 2015 | $6,873 | $165,410 | $50,890 | $114,520 |
| 2014 | $6,873 | $165,410 | $50,890 | $114,520 |
Source: Public Records
Map
Nearby Homes
- 500 Whalley Ave
- 506 Whalley Ave
- 494 Whalley Ave
- 117 Brownell St
- 113 Brownell St
- 113 Brownell St Unit 3rd floor
- 113 Brownell St Unit 2nd floor
- 113 Brownell St Unit 1st floor
- 478 Whalley Ave
- 503 Whalley Ave
- 124 Brownell St
- 507 Whalley Ave
- 109 Brownell St
- 491 Whalley Ave Unit 1st Fl
- 491 Whalley Ave
- 1xxx Blake St
- 122 Brownell St
- 116 Brownell St
- 105 Brownell St
- 105 Brownell St Unit 3