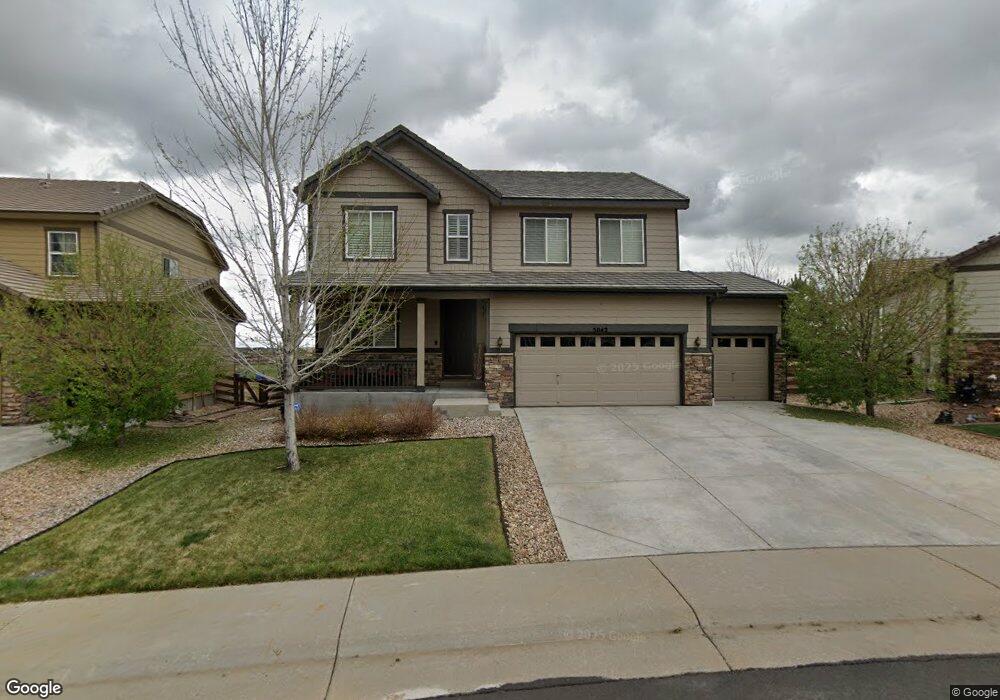
5042 S Netherland Way Centennial, CO 80015
Copperleaf NeighborhoodEstimated Value: $719,000 - $756,000
5
Beds
4
Baths
3,729
Sq Ft
$196/Sq Ft
Est. Value
About This Home
This home is located at 5042 S Netherland Way, Centennial, CO 80015 and is currently estimated at $731,913, approximately $196 per square foot. 5042 S Netherland Way is a home located in Arapahoe County with nearby schools including Timberline Elementary School, Thunder Ridge Middle School, and Eaglecrest High School.
Ownership History
Date
Name
Owned For
Owner Type
Purchase Details
Closed on
May 1, 2019
Sold by
Moore Daniel F and Moore Amy E
Bought by
Weilman Ryan David and Weilman Solange Bevel
Current Estimated Value
Home Financials for this Owner
Home Financials are based on the most recent Mortgage that was taken out on this home.
Original Mortgage
$79,185
Outstanding Balance
$60,843
Interest Rate
4.2%
Mortgage Type
Credit Line Revolving
Estimated Equity
$671,070
Purchase Details
Closed on
Aug 14, 2015
Sold by
Dehart Sarah J
Bought by
Moore Daniel F and Moore Amy E
Home Financials for this Owner
Home Financials are based on the most recent Mortgage that was taken out on this home.
Original Mortgage
$402,014
Interest Rate
3.87%
Mortgage Type
FHA
Purchase Details
Closed on
Mar 21, 2013
Sold by
Richmond Homes Of Colorado Inc
Bought by
Dehart Sarah J
Home Financials for this Owner
Home Financials are based on the most recent Mortgage that was taken out on this home.
Original Mortgage
$373,669
Interest Rate
3.25%
Mortgage Type
FHA
Create a Home Valuation Report for This Property
The Home Valuation Report is an in-depth analysis detailing your home's value as well as a comparison with similar homes in the area
Home Values in the Area
Average Home Value in this Area
Purchase History
| Date | Buyer | Sale Price | Title Company |
|---|---|---|---|
| Weilman Ryan David | $527,900 | Fidelity National Title | |
| Moore Daniel F | $439,000 | Fidelity National Title Ins | |
| Dehart Sarah J | $380,600 | None Available |
Source: Public Records
Mortgage History
| Date | Status | Borrower | Loan Amount |
|---|---|---|---|
| Open | Weilman Ryan David | $79,185 | |
| Previous Owner | Moore Daniel F | $402,014 | |
| Previous Owner | Dehart Sarah J | $373,669 |
Source: Public Records
Tax History Compared to Growth
Tax History
| Year | Tax Paid | Tax Assessment Tax Assessment Total Assessment is a certain percentage of the fair market value that is determined by local assessors to be the total taxable value of land and additions on the property. | Land | Improvement |
|---|---|---|---|---|
| 2024 | $6,188 | $49,111 | -- | -- |
| 2023 | $6,188 | $49,111 | $0 | $0 |
| 2022 | $5,024 | $38,558 | $0 | $0 |
| 2021 | $5,042 | $38,558 | $0 | $0 |
| 2020 | $4,865 | $0 | $0 | $0 |
| 2019 | $5,716 | $38,024 | $0 | $0 |
| 2018 | $5,568 | $34,394 | $0 | $0 |
| 2017 | $5,537 | $34,394 | $0 | $0 |
| 2016 | $5,198 | $31,387 | $0 | $0 |
| 2015 | $5,080 | $31,387 | $0 | $0 |
| 2014 | $5,164 | $29,388 | $0 | $0 |
| 2013 | -- | $2,670 | $0 | $0 |
Source: Public Records
Map
Nearby Homes
- 4861 S Picadilly Ct
- 4839 S Picadilly Ct
- 4862 S Picadilly Ct
- 21893 E Layton Dr
- 21408 E Union Place
- 20785 E Bellewood Place
- 5360 S Picadilly Ct
- 5021 S Rome St
- 4683 S Nepal Way
- 4656 S Malaya Ct
- 5412 S Quatar Cir
- 21064 E Crestline Cir
- 20412 E Chenango Place
- 20551 E Union Ave
- 20473 E Layton Ave
- 22252 E Bellewood Place
- 20431 E Union Cir
- 5523 S Malta St
- 5200 S Jebel St
- 5220 S Sicily St
- 5032 S Netherland Way
- 5052 S Netherland Way
- 5022 S Netherland Way
- 5062 S Netherland Way
- 5031 S Netherland Way
- 5051 S Netherland Way
- 5012 S Netherland Way
- 5021 S Netherland Way
- 5072 S Netherland Way
- 5071 S Netherland Way
- 5011 S Netherland Way
- 5082 S Netherland Way
- 5081 S Netherland Way
- 4972 S Odessa Ct
- 5070 S Netherland St
- 5002 S Netherland Way
- 5060 S Netherland St
- 5080 S Netherland St
- 5050 S Netherland St
- 5001 S Netherland Way