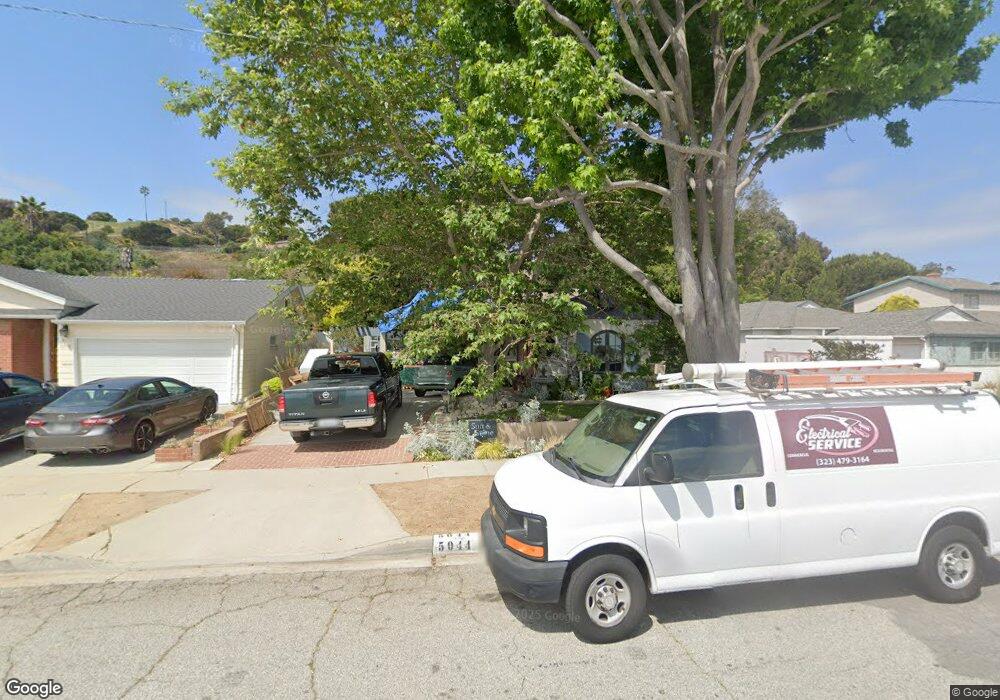
5044 Newton St Torrance, CA 90505
Riviera NeighborhoodEstimated Value: $1,308,000 - $1,572,000
3
Beds
2
Baths
1,500
Sq Ft
$985/Sq Ft
Est. Value
About This Home
This home is located at 5044 Newton St, Torrance, CA 90505 and is currently estimated at $1,478,159, approximately $985 per square foot. 5044 Newton St is a home located in Los Angeles County with nearby schools including Riviera Elementary School, Edward J. Richardson Middle School, and South High School.
Ownership History
Date
Name
Owned For
Owner Type
Purchase Details
Closed on
Apr 15, 2002
Sold by
Warren Candice Dawn
Bought by
Carretta Stephen M and Carretta Jamie J
Current Estimated Value
Home Financials for this Owner
Home Financials are based on the most recent Mortgage that was taken out on this home.
Original Mortgage
$224,000
Outstanding Balance
$93,256
Interest Rate
6.87%
Estimated Equity
$1,384,903
Purchase Details
Closed on
Feb 1, 2002
Sold by
Warren Donald G and Warren Kay
Bought by
Warren Candice Dawn
Purchase Details
Closed on
Jun 3, 1996
Sold by
Lagrand Audrey E and The Audrey E Lagrand Living Tr
Bought by
Warren Donald G and Warren Kay
Home Financials for this Owner
Home Financials are based on the most recent Mortgage that was taken out on this home.
Original Mortgage
$207,000
Interest Rate
2.82%
Create a Home Valuation Report for This Property
The Home Valuation Report is an in-depth analysis detailing your home's value as well as a comparison with similar homes in the area
Home Values in the Area
Average Home Value in this Area
Purchase History
| Date | Buyer | Sale Price | Title Company |
|---|---|---|---|
| Carretta Stephen M | $449,000 | Chicago Title Co | |
| Warren Candice Dawn | -- | Chicago Title | |
| Warren Donald G | -- | North American Title Co |
Source: Public Records
Mortgage History
| Date | Status | Borrower | Loan Amount |
|---|---|---|---|
| Open | Carretta Stephen M | $224,000 | |
| Previous Owner | Warren Donald G | $207,000 |
Source: Public Records
Tax History Compared to Growth
Tax History
| Year | Tax Paid | Tax Assessment Tax Assessment Total Assessment is a certain percentage of the fair market value that is determined by local assessors to be the total taxable value of land and additions on the property. | Land | Improvement |
|---|---|---|---|---|
| 2025 | $7,836 | $679,438 | $487,497 | $191,941 |
| 2024 | $7,836 | $666,117 | $477,939 | $188,178 |
| 2023 | $7,693 | $653,057 | $468,568 | $184,489 |
| 2022 | $7,591 | $640,253 | $459,381 | $180,872 |
| 2021 | $7,454 | $627,700 | $450,374 | $177,326 |
| 2019 | $7,240 | $609,083 | $437,016 | $172,067 |
| 2018 | $7,022 | $597,142 | $428,448 | $168,694 |
| 2016 | $6,712 | $573,957 | $411,812 | $162,145 |
| 2015 | $6,567 | $565,337 | $405,627 | $159,710 |
| 2014 | $6,403 | $554,264 | $397,682 | $156,582 |
Source: Public Records
Map
Nearby Homes
- 5312 Doris Way
- 5510 Greenmeadows St
- 5109 Paseo Del Pavon
- 5013 Macafee Rd
- 544 Calle Mayor
- 4817 Macafee Rd
- 445 Calle Mayor
- 237 Via Los Miradores
- 4600 Paseo de Las Tortugas
- 875 Calle de Arboles
- 23552 Kathryn Ave
- 23608 Kathryn Ave
- 3321 Via la Selva
- 221 Via Los Miradores
- 204 Via Colusa
- 4262 Newton St
- 3901 Via Cardelina
- 3609 Palos Verdes Dr N
- 309 Via Linda Vista
- 438 Calle de Aragon
- 5050 Newton St
- 5038 Newton St
- 5056 Newton St
- 5032 Newton St
- 5102 Newton St
- 5026 Newton St
- 5108 Newton St
- 5020 Newton St
- 5114 Newton St
- 5014 Newton St
- 5120 Newton St
- 5008 Newton St
- 5119 Newton St
- 5126 Newton St
- 5002 Newton St
- 5125 Newton St
- 5132 Newton St
- 5026 Pacific Coast Hwy
- 5032 Pacific Coast Hwy
- 5020 Pacific Coast Hwy