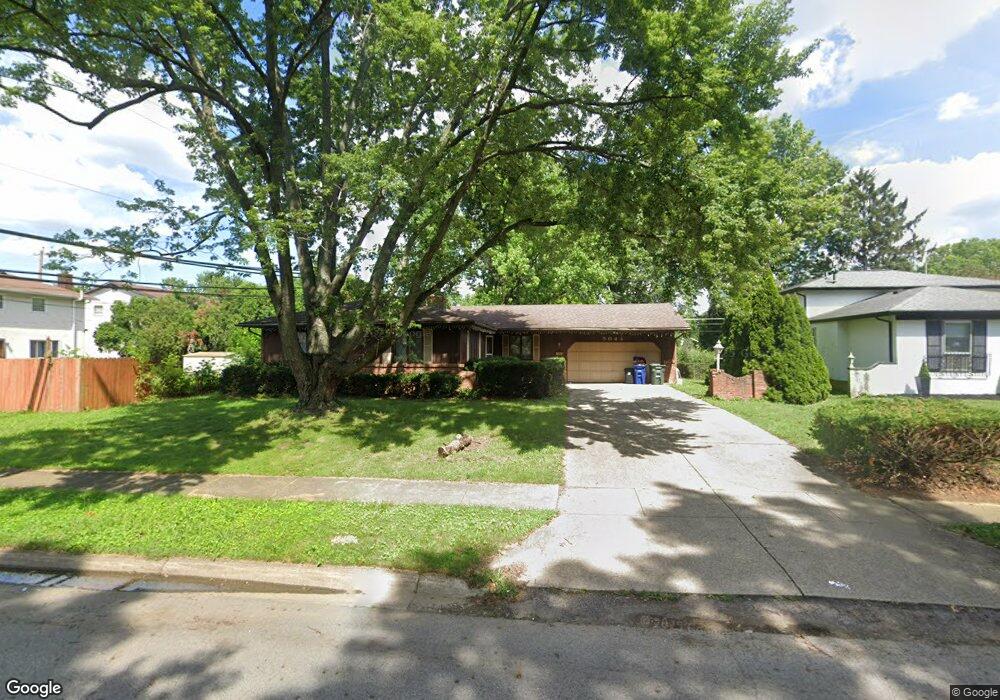
5044 Shadycrest Rd Columbus, OH 43229
Forest Park East NeighborhoodEstimated Value: $257,000 - $332,000
3
Beds
2
Baths
1,655
Sq Ft
$182/Sq Ft
Est. Value
About This Home
This home is located at 5044 Shadycrest Rd, Columbus, OH 43229 and is currently estimated at $300,779, approximately $181 per square foot. 5044 Shadycrest Rd is a home located in Franklin County with nearby schools including Parkmoor Elementary School, Woodward Park Middle School, and Northland High School.
Ownership History
Date
Name
Owned For
Owner Type
Purchase Details
Closed on
Dec 22, 2020
Sold by
Webster Edith J H
Bought by
Heer John L and Heer Rebecca E
Current Estimated Value
Home Financials for this Owner
Home Financials are based on the most recent Mortgage that was taken out on this home.
Original Mortgage
$132,000
Interest Rate
2.65%
Mortgage Type
Seller Take Back
Purchase Details
Closed on
Apr 28, 2004
Sold by
Herron Sharon A and Herron David E
Bought by
Webster Edith J H
Home Financials for this Owner
Home Financials are based on the most recent Mortgage that was taken out on this home.
Original Mortgage
$119,200
Interest Rate
4.75%
Mortgage Type
Purchase Money Mortgage
Purchase Details
Closed on
Feb 11, 2003
Sold by
Estate Of Georganna Mays Garey
Bought by
Herron Sharon A and Strohl Deborah A
Purchase Details
Closed on
Aug 31, 1990
Bought by
Garey Roy S and Garey Georganna
Create a Home Valuation Report for This Property
The Home Valuation Report is an in-depth analysis detailing your home's value as well as a comparison with similar homes in the area
Home Values in the Area
Average Home Value in this Area
Purchase History
| Date | Buyer | Sale Price | Title Company |
|---|---|---|---|
| Heer John L | $132,000 | None Available | |
| Webster Edith J H | $149,000 | Christopher Land Title Inc | |
| Herron Sharon A | -- | -- | |
| Garey Roy S | $99,500 | -- |
Source: Public Records
Mortgage History
| Date | Status | Borrower | Loan Amount |
|---|---|---|---|
| Previous Owner | Heer John L | $132,000 | |
| Previous Owner | Webster Edith J H | $119,200 |
Source: Public Records
Tax History Compared to Growth
Tax History
| Year | Tax Paid | Tax Assessment Tax Assessment Total Assessment is a certain percentage of the fair market value that is determined by local assessors to be the total taxable value of land and additions on the property. | Land | Improvement |
|---|---|---|---|---|
| 2024 | $4,168 | $90,940 | $22,230 | $68,710 |
| 2023 | $4,198 | $90,930 | $22,225 | $68,705 |
| 2022 | $3,438 | $61,880 | $14,000 | $47,880 |
| 2021 | $3,215 | $61,880 | $14,000 | $47,880 |
| 2020 | $3,219 | $61,880 | $14,000 | $47,880 |
| 2019 | $3,009 | $49,600 | $11,200 | $38,400 |
| 2018 | $2,831 | $49,600 | $11,200 | $38,400 |
| 2017 | $2,968 | $49,600 | $11,200 | $38,400 |
| 2016 | $2,929 | $44,210 | $10,500 | $33,710 |
| 2015 | $2,659 | $44,210 | $10,500 | $33,710 |
| 2014 | $2,665 | $44,210 | $10,500 | $33,710 |
| 2013 | $1,442 | $48,510 | $11,060 | $37,450 |
Source: Public Records
Map
Nearby Homes
- 5022 Sienna Ln
- 1704 Riverbirch Dr
- 4923 Karl Rd Unit 4925
- 1485 Norma Rd
- 5231 Arrowood Ct
- 4852 Colonel Perry Dr
- 5124 Northcliff Loop W
- 1493 Boxwood Dr
- 1385 Thurell Rd
- 4816 Bourke Rd
- 4800 Bourke Rd
- 4815 Bourke Rd
- 1414 Alvina Dr
- 4761 Colonel Perry Dr
- 4791 Bourke Rd
- 2033 Brittany Rd
- 2058 Northcliff Dr
- 4714 Ascot Dr
- 4849 Heatherton Dr
- 5056 Northtowne Blvd Unit 5054
- 5036 Shadycrest Rd
- 1667 Pin Oak Dr
- 1673 Pin Oak Dr
- 5019 Ivyhill Loop W
- 1632 Sienna Ln N
- 1688 Ivyhill Loop N
- 5057 Shadycrest Rd
- 1681 Pin Oak Dr
- 5065 Shadycrest Rd
- 5011 Ivyhill Loop N
- 5012 Shadycrest Rd
- 5011 Ivyhill Loop W
- 1624 Sienna Ln N
- 5021 Shadycrest Rd
- 5073 Shadycrest Rd
- 1656 Pin Oak Dr
- 1694 Ivyhill Loop N
- 1664 Pin Oak Dr
- 1689 Pin Oak Dr
- 1672 Pin Oak Dr