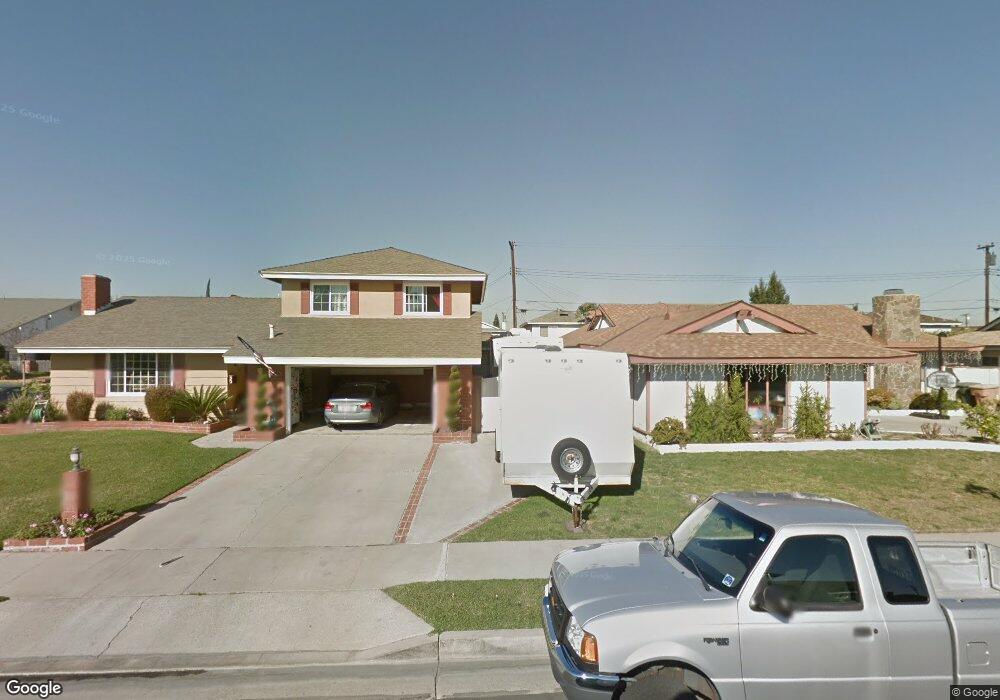
5045 Brunswick Dr Cypress, CA 90630
Estimated Value: $1,287,000 - $1,382,000
4
Beds
3
Baths
2,197
Sq Ft
$604/Sq Ft
Est. Value
About This Home
This home is located at 5045 Brunswick Dr, Cypress, CA 90630 and is currently estimated at $1,327,691, approximately $604 per square foot. 5045 Brunswick Dr is a home located in Orange County with nearby schools including Juliet Morris Elementary School, Lexington Junior High School, and Cypress High School.
Ownership History
Date
Name
Owned For
Owner Type
Purchase Details
Closed on
Jul 22, 2024
Sold by
Mcleod Wade and Mcleod Tammie
Bought by
Wade F Mcleod Family Trust and Mcleod
Current Estimated Value
Home Financials for this Owner
Home Financials are based on the most recent Mortgage that was taken out on this home.
Original Mortgage
$175,000
Outstanding Balance
$172,894
Interest Rate
6.95%
Mortgage Type
New Conventional
Estimated Equity
$1,154,797
Purchase Details
Closed on
Nov 1, 2017
Sold by
Mcleod Wade F and Mcleod Tammie
Bought by
Mcleod Wade F and Mcleod Tammie V
Purchase Details
Closed on
Feb 23, 2000
Sold by
Hensley Jerry R and Hensley Betty J
Bought by
Mcleod Wade F and Mcleod Tammie
Home Financials for this Owner
Home Financials are based on the most recent Mortgage that was taken out on this home.
Original Mortgage
$189,000
Interest Rate
8.26%
Create a Home Valuation Report for This Property
The Home Valuation Report is an in-depth analysis detailing your home's value as well as a comparison with similar homes in the area
Home Values in the Area
Average Home Value in this Area
Purchase History
We collect this data history from publicly available records. To have your information removed, we recommend requesting removal directly through your county’s website.
| Date | Buyer | Sale Price | Title Company |
|---|---|---|---|
| Wade F Mcleod Family Trust | -- | Priority Title | |
| Mcleod Wade | $248,981 | Priority Title | |
| Mcleod Wade F | -- | None Available | |
| Mcleod Wade F | $317,500 | Lawyers Title Company |
Source: Public Records
Mortgage History
We collect this data history from publicly available records. To have your information removed, we recommend requesting removal directly through your county’s website.
| Date | Status | Borrower | Loan Amount |
|---|---|---|---|
| Open | Mcleod Wade | $175,000 | |
| Previous Owner | Mcleod Wade F | $189,000 |
Source: Public Records
Tax History
| Year | Tax Paid | Tax Assessment Tax Assessment Total Assessment is a certain percentage of the fair market value that is determined by local assessors to be the total taxable value of land and additions on the property. | Land | Improvement |
|---|---|---|---|---|
| 2025 | $5,510 | $487,981 | $331,605 | $156,376 |
| 2024 | $5,510 | $478,413 | $325,103 | $153,310 |
| 2023 | $5,383 | $469,033 | $318,729 | $150,304 |
| 2022 | $5,319 | $459,837 | $312,480 | $147,357 |
| 2021 | $5,248 | $450,821 | $306,353 | $144,468 |
| 2020 | $5,227 | $446,199 | $303,212 | $142,987 |
| 2019 | $5,080 | $437,450 | $297,266 | $140,184 |
| 2018 | $5,011 | $428,873 | $291,437 | $137,436 |
| 2017 | $4,839 | $420,464 | $285,722 | $134,742 |
| 2016 | $4,797 | $412,220 | $280,120 | $132,100 |
| 2015 | $4,761 | $406,029 | $275,913 | $130,116 |
| 2014 | $4,508 | $398,076 | $270,508 | $127,568 |
Source: Public Records
Map
Nearby Homes
- 5102 Canterbury Dr
- 5258 Hanover Dr
- 9598 Naples Dr
- 5101 Myra Ave
- 5353 Cumberland Dr
- 9535 Palermo Way
- 5332 Belle Ave
- 9011 Cerise Ln Unit 129
- 9001 Cerise Ln Unit 109
- 9001 Cerise Ln Unit 113
- 9001 Cerise Ln Unit 111
- 4681 Larwin Ave
- 8762 8764 La Salle
- 5089 Saratoga Ave
- 5109 Saratoga Ave
- 4586 Larwin Ave
- 5619 Ball Rd
- 5541 Marcella Ave
- 4395 Avenida Carmel
- 5316 Vista Real
- 5054 Melbourne Dr
- 5064 Melbourne Dr
- 5044 Melbourne Dr
- 5055 Brunswick Dr
- 5065 Brunswick Dr
- 5074 Melbourne Dr
- 5053 Melbourne Dr
- 5075 Brunswick Dr
- 5043 Melbourne Dr
- 5063 Melbourne Dr
- 5084 Melbourne Dr
- 5073 Melbourne Dr
- 5085 Brunswick Dr
- 5033 Melbourne Dr
- 9821 Newcastle Ln
- 9831 Newcastle Ln
- 9811 Newcastle Ln
- 5094 Melbourne Dr
- 9841 Newcastle Ln
- 5083 Melbourne Dr
Your Personal Tour Guide
Ask me questions while you tour the home.