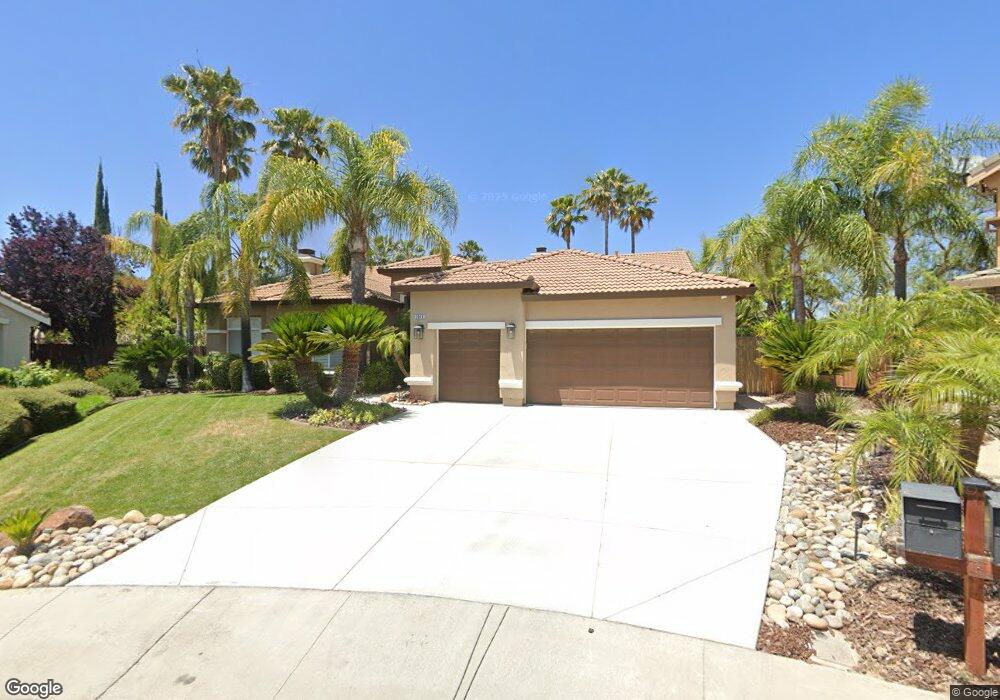
5046 Botting Ct Antioch, CA 94531
Lone Tree Valley NeighborhoodEstimated Value: $960,000 - $1,012,000
5
Beds
3
Baths
3,477
Sq Ft
$285/Sq Ft
Est. Value
About This Home
This home is located at 5046 Botting Ct, Antioch, CA 94531 and is currently estimated at $990,017, approximately $284 per square foot. 5046 Botting Ct is a home located in Contra Costa County with nearby schools including John Muir Elementary School, Dallas Ranch Middle School, and Deer Valley High School.
Ownership History
Date
Name
Owned For
Owner Type
Purchase Details
Closed on
Mar 23, 2018
Sold by
Rea Gregory S and Rea Beverly A
Bought by
Kennedy Michael K and Kennedy Lisa A
Current Estimated Value
Home Financials for this Owner
Home Financials are based on the most recent Mortgage that was taken out on this home.
Original Mortgage
$453,000
Outstanding Balance
$132,435
Interest Rate
4.38%
Mortgage Type
New Conventional
Estimated Equity
$857,582
Purchase Details
Closed on
Sep 9, 2016
Sold by
Rea Gregory S and Rea Beverly A
Bought by
Rea Gregory S and Rea Beverly A
Purchase Details
Closed on
Jul 12, 2000
Sold by
Meritage Homes Of Northern Ca Inc
Bought by
Rea Gregory S and Rea Beverly A
Home Financials for this Owner
Home Financials are based on the most recent Mortgage that was taken out on this home.
Original Mortgage
$240,000
Interest Rate
8.37%
Mortgage Type
Purchase Money Mortgage
Create a Home Valuation Report for This Property
The Home Valuation Report is an in-depth analysis detailing your home's value as well as a comparison with similar homes in the area
Home Values in the Area
Average Home Value in this Area
Purchase History
| Date | Buyer | Sale Price | Title Company |
|---|---|---|---|
| Kennedy Michael K | $800,000 | Old Republic Title Compan | |
| Rea Gregory S | -- | None Available | |
| Rea Gregory S | $420,500 | First American Title Guarant |
Source: Public Records
Mortgage History
| Date | Status | Borrower | Loan Amount |
|---|---|---|---|
| Open | Kennedy Michael K | $453,000 | |
| Previous Owner | Rea Gregory S | $240,000 | |
| Closed | Rea Gregory S | $60,000 |
Source: Public Records
Tax History
| Year | Tax Paid | Tax Assessment Tax Assessment Total Assessment is a certain percentage of the fair market value that is determined by local assessors to be the total taxable value of land and additions on the property. | Land | Improvement |
|---|---|---|---|---|
| 2025 | $10,196 | $910,258 | $142,226 | $768,032 |
| 2024 | $9,625 | $892,411 | $139,438 | $752,973 |
| 2023 | $9,625 | $874,913 | $136,704 | $738,209 |
| 2022 | $9,468 | $857,759 | $134,024 | $723,735 |
| 2021 | $9,188 | $840,942 | $131,397 | $709,545 |
| 2019 | $9,010 | $816,000 | $127,500 | $688,500 |
| 2018 | $7,283 | $664,283 | $111,235 | $553,048 |
| 2017 | $6,755 | $613,500 | $102,731 | $510,769 |
| 2016 | $5,977 | $540,000 | $91,138 | $448,862 |
| 2015 | $6,061 | $512,500 | $86,497 | $426,003 |
| 2014 | $5,950 | $479,500 | $80,928 | $398,572 |
Source: Public Records
Map
Nearby Homes
- 5065 Carbondale Way
- 5106 Watkings Way
- 5004 Star Mine Way
- 5227 Ramsdell Ct
- 4937 Eastview Way
- 4125 Rogers Canyon Rd
- 1157 Rockspring Way
- 5388 Southwood Way
- 1256 Mokelumne Ct
- 1246 Oak Haven Way
- 5448 Southwood Way
- 4836 Belford Peak Way
- 4737 Crestone Peak Ct
- 1821 Kern Mountain Way
- 4722 Cache Peak Dr
- 1879 Mount Conness Way
- 1736 Nandina Ct
- 4729 Matterhorn Ct
- 4109 S Royal Links Cir
- 1928 Badger Pass Way
- 5048 Botting Ct
- 5044 Botting Ct
- 5063 Heacock Way
- 5129 Hayward Ct
- 5059 Heacock Way
- 5055 Heacock Way
- 5067 Heacock Way
- 5042 Botting Ct
- 5050 Botting Ct
- 5131 Hayward Ct
- 5054 Carbondale Way
- 5127 Hayward Ct
- 5040 Botting Ct
- 5058 Carbondale Way
- 5071 Heacock Way
- 5047 Heacock Way
- 5043 Heacock Way
- 5062 Carbondale Way
- 5133 Hayward Ct
- 5125 Hayward Ct
Your Personal Tour Guide
Ask me questions while you tour the home.